
From April 1st, 2015, to March 31st, 2016, 45 hemodialysis units took part in the surveillance of vascular access–related bloodstream infections (VARBSIs) in hemodialysis (HD) patients, for a combined total of 54,717 patient-periods (Table 1), slightly less than the preceding year. Participating units reported 136 VARBSIs in 129 patients. Patient-periods involving a fistula account for 41.0% of patient-periods. The 2015-2016 VARBSI incidence rates are 0.06 cases per 100 patient-periods for patients with an arteriovenous (AV) fistula, 0.32 for patients with a synthetic fistula (graft), 0.33 for patients with a permanent catheter and 3.34 for patients with a temporary catheter. In 2015–2016, incidence rates are significantly lower than in 2011-2015. This decrease is mainly attributable to a decrease in VARBSIs on AV fistula with buttonhole (rates per 100 patient-periods) and to a decrease of VARBSIs on permanent catheters (rate per 1,000 catheter-days). A minimum of 11 periods of data are to be provided for facilities’ data to be included in this surveillance report. Data were extracted on May 31st, 2016.
Updated : March 3, 2017
Version française
Table 1 – Participation of Hemodialysis Units in the Surveillance of VARBSIs in Hemodialysis Patients, Québec, 2011–2012 to 2015–2016
2011 - 2012 | 2012 - 2013 | 2013 - 2014 | 2014 - 2015 | 2015 - 2016 | |
|---|---|---|---|---|---|
| Units (N) | 40 | 42 | 42 | 45 | 45 |
| Patients monitored (average number per period) | 3,855 | 3,976 | 3,984 | 4,303 | 4,209 |
| Patient-periods* (N) | 50,111 | 51,693 | 51,791 | 55,939 | 54,717 |
| Patient-months (N) | 47,037 | 48,336 | 48,469 | 52,316 | 51,363 |
| Dialysis sessions (N) | 604,766 | 621,465 | 623,172 | 672,639 | 660,376 |
| Catheter-days (N) | 750,919 | 798,816 | 824,834 | 891,802 | 909,792 |
| VARBSIs (cat. 1a, 1b and 1c, N) | 214 | 218 | 151 | 154 | 136 |
| VARBSIs with AV fistulas or grafts (N) | 38 | 46 | 25 | 23 | 19 |
| VARBSIs with permanent or temporary catheters (N) | 176 | 172 | 126 | 131 | 117 |
| Infected patients (N) | 205 | 209 | 143 | 141 | 129 |
Incidence rates
The 2015-2016 VARBSI incidence rate is 0.25 cases per 100 patient-periods. The incidence rates are 0.06 for patients with an AV fistula, 0.32 for patients with a graft, 0.33 for patients with a permanent catheter and 3.34 for patients with a temporary catheter (Figure 1).
In patients with AV fistulas, the VARBSI incidence rate is higher when the buttonhole technique is used (0.13 per 100 patient-periods versus 0.05). Incidence rate for patients with a graft (0.32) is higher than for patients with an AV fistula (0.06); incidence rates for patients with AV fistulas remain much lower than for patients with a permanent catheters (0.33). The incidence rate for patients with a temporary catheter is still the highest; it is, however, the least frequently used vascular access (Figures 1 and 2). Patients with a temporary catheter (3.34) present an incidence rate much higher than patients with a permanent catheter (0.33).
Figure 1 – VARBSI Incidence Rate by Type of Vascular Access, Québec, 2015–2016 (Incidence Rate per 100 Patient-periods [95% CI])
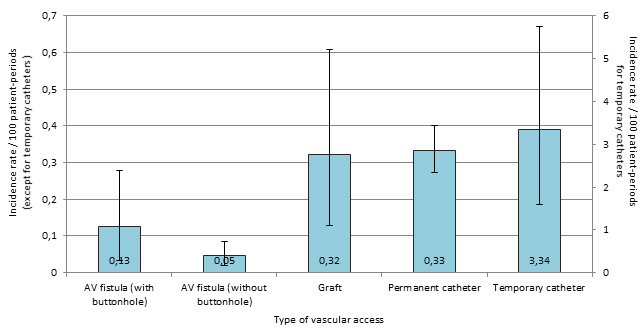
Note: 95% CI: 95% confidence interval
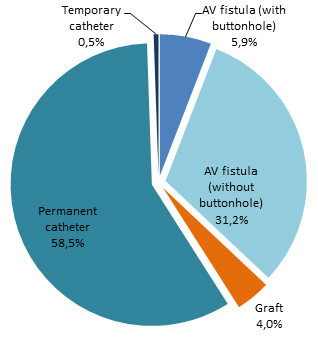
Permanent catheters were the most commonly used type of vascular access, followed by AV fistulas without the use of the buttonhole technique (Figure 2).
Figure 2 – Breakdown of Patient-periods by Type of Vascular Access, Québec, 2015–2016 (%)
Incidence rate time trends
In 2015–2016, incidence rates are significantly lower than in 2011-2015. This decrease is mainly attributable to a decrease in VARBSIs on AV fistula with buttonhole and to a decrease of VARBSIs on permanent catheters (Table 2 and Figures 3 and 4).
Figure 3 – VARBSI Incidence Rates by Type of Vascular Access, Québec, 2011–2015* and 2015–2016 (Incidence Rate per 100 Patient-periods [95% CI])
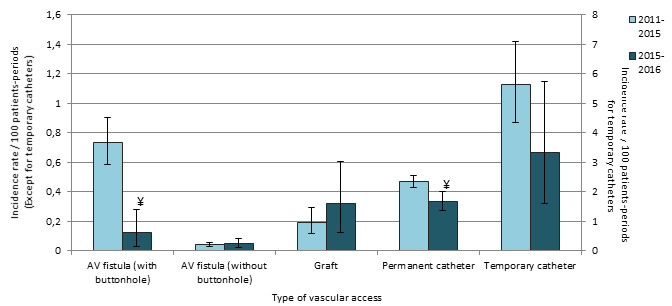
*Incidence rates for AV fistulas, with and without buttonhole, are limited to data from 2013-2014 to 2015-2016, as information on the use of the buttonhole technique was not collected before 2013-2014.
¥ : Significant difference (p ˂ 0.05) between 2011-2015 and 2015-2016.
Table 2 – VARBSI Incidence Rates by Type of Vascular Access, Québec, 2011–2015 and 2015–2016 (Incidence Rate per 100 Patient-periods and per 1,000 Vascular-Access Days [95% CI])
| Type of Vascular Access | Incidence Rate/100 Patient-periods [95% CI] | Taux d'incidence / 1 000 j.-c. [I.C. 95 %] | ||
|---|---|---|---|---|
2011-2015 | 2015-2016 | 2011-2015 | 2015-2016 | |
| AV fistula or graft | 0.14 [0.12 ; 0.17] | 0.09 [0.05 ; 0.13]¥ | - | - |
| AV fistula | 0.14 [0.11 ; 0.16] | 0.06 [0.03 ; 0.10]¥ | - | - |
| With buttonhole* | 0.74 [0.59 ; 0.90] | 0.13 [0.03 ; 0.28]¥ | - | - |
| Without buttonhole* | 0.04 [0.03 ; 0.06] | 0.05 [0.02 ; 0.09] | - | - |
| Graft | 0.19 [0.12 ; 0.29] | 0.32 [0.13 ; 0.61] | - | - |
| Permanent or temporary catheter | 0.52 [0.48 ; 0.56] | 0.36 [0.30 ; 0.43]¥ | 0.19 [0.18; 0.19] | 0.13 [0.12 ; 0.14]¥ |
| Permanent catheter | 0.47 [0.43 ; 0.51] | 0.33 [0.27 ; 0.40]¥ | 0.17 [0.15 ; 0.18] | 0.12 [0.10 ; 0.14]¥ |
| Temporary catheter | 5.64 [4.36 ; 7.08] | 3.34 [1.59 ; 5.74] | 2.01 [1.55 ; 2.52] | 1.19 [0.57 ; 2.05] |
| Total | 0.35 [0.33 ; 0.38] | 0.25 [0.21 ; 0.29]¥ | - | - |
* Incidence rates for AV fistulas, with and without buttonhole, are limited to data from 2013-2014 to 2015-2016, as information on the use of the buttonhole technique was not collected before 2013-2014.
¥ Significant difference (p ˂ 0,05) between 2011-2015 and 2015-2016.
Figure 4 – VARBSI Incidence Rates by Type of Vascular Access, for Units Participating Since 2011–2012 (N = 38)*, Québec, 2011–2012 to 2015–2016 (Incidence Rate per 100 Patient-periods)
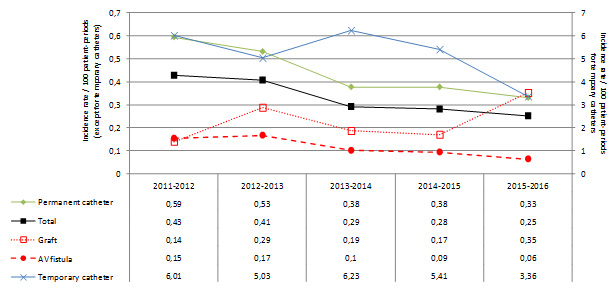
* Data analyzed are data from dialysis units that participated at least 11 periods per year, for every year from 2011-2012 to 2015-2016.
Time trends in patient-periods are presented in Figure 5. As fistula use is decreasing, catheter use has increased through the last five years. Patient-periods with a temporary catheter, the vascular access presenting the highest incidence rate, had decreased in 2013-2014 and 2014-2015, to increase again in 2015-2016.
Figure 5 – Time Trends in Patient-periods by Type of Vascular Access, for Units Participating Since 2011–2012 (N = 38)*, Québec, 2011–2012 to 2015–2016
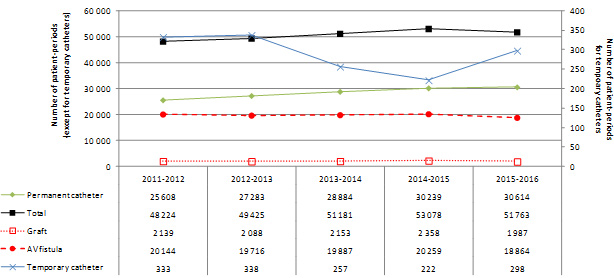
* Data analyzed are data from dialysis units that participated at least 11 periods per year, for every year from 2011-2012 to 2015-2016.
Table 3 – Breakdown of Patient-periods by Type of Vascular Access, 2011–2015 and 2015–2016 (%)
2011-2015 | 2015-2016 | |||
|---|---|---|---|---|
VARBSI (N) | Patient-periods (N, %) | VARBSI (N) | Patient-periods (N, %) | |
| AV fistula or graft | 132 | 92,980 (44.4 %) | 19 | 22,435 (41.0 %) |
| AV fistula | 114 | 83,686 (40.0 %) | 12 | 20,266 (37.0 %) |
| With buttonhole* | 83 | 11,262 (5.4 %) | 4 | 3,209 (5.9 %) |
| Without buttonhole* | 31 | 72,650 (34.7 %) | 8 | 17,057 (31.2 %) |
| Graft | 18 | 9,294 (4.4 %) | 7 | 2,169 (4.0 %) |
| Permanent or temporary catheter | 605 | 116,226 (55.6 %) | 117 | 32,310 (59.0 %) |
| Permanent catheter | 539 | 115,165 (55.0 %) | 107 | 32,011 (58.5 %) |
| Temporary catheter | 66 | 1,171 (0.6 %) | 10 | 299 (0.5 %) |
| Total (N) | 737 | 209,206 | 136 | 54,745 |
Description of cases
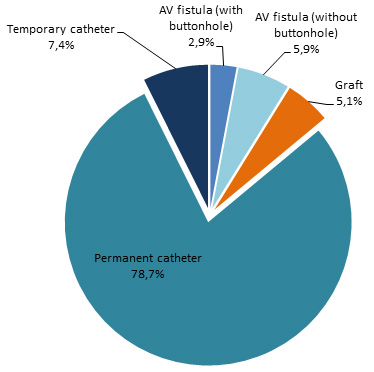
The vast majority (86%, or 117 cases) of VARBSIs occurred in patients who receive their hemodialysis treatment via catheter (Figure 6). Only 9% of cases occurred in patients with an AV fistula. The buttonhole technique is used in a third of cases.
Figure 6 – Breakdown of VARBSIs by Type of Vascular Access, Québec, 2015–2016 (N = 136)
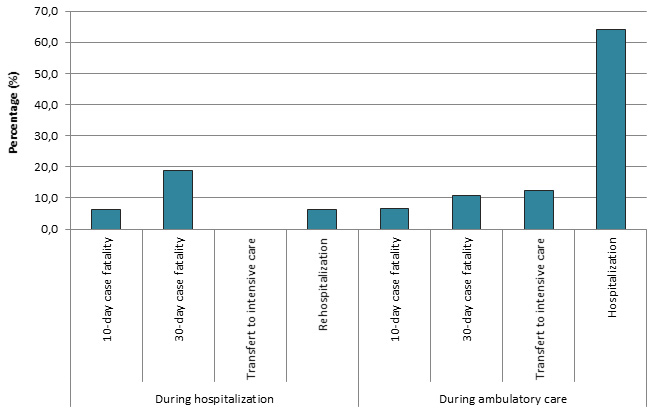
A majority of cases occurred in ambulatory care and two thirds (64.2%) of these cases were subsequently admitted. Overall, 11.8% of VARBSI cases resulted in death within 30 days following the onset of bacteremia. Death occurred in 18.8% of cases of VARBSI among hospitalized patients (Table 4 and Figure 7), compared with 10.8% of cases among patients receiving ambulatory care.
Table 4 – 30-Day Case Fatality, Percentage of Transfers to ICU and Percentage of Hospitalizations and Rehospitalizations During a VARBSI Episode, by Origin of Acquisition, Québec, 2015–2016 (N, %)
| Origin of Acquisition | Complication | Number of VARBSI Cases Monitored | Presence of Complication | |
|---|---|---|---|---|
N | % | |||
| During hospitalization | Death within 10 days | 16 | 1 | 6.3 |
| Death within 30 days | 16 | 3 | 18.8 | |
| Transfer to ICU | 16 | 0 | 0 | |
| Rehospitalization | 16 | 1 | 6.3 | |
| During ambulatory care | Death within 10 days | 120 | 8 | 6.7 |
| Death within 30 days | 120 | 13 | 10.8 | |
| Transfer to ICU | 120 | 15 | 12.5 | |
| Hospitalization | 120 | 77 | 64.2 | |
Figure 7 – 30-Day Case Fatality, Percentage of Transfers to ICU and Percentage of Hospitalizations and Rehospitalizations During a VARBSI Episode, by Origin of Acquisition, Québec, 2015–2016 (%)
Microbiology
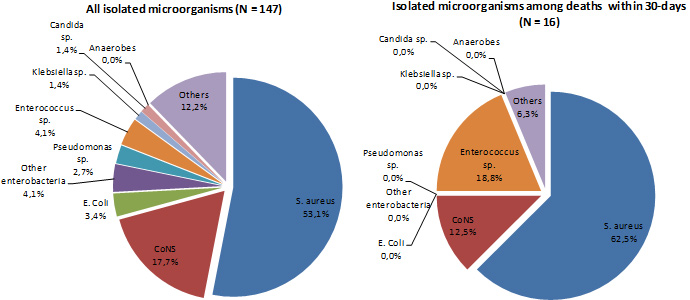
Figure 8 shows that Staphylococcus aureus was the most frequently isolated microorganism in all VARBSI cases (n=78; 53%); followed by coagulase-negative Staphylococcus (CoNS; n= 26; 14%) and enterobacteria. S. aureus was the most frequently isolated microorganism in cases resulting in death (62.5%).
Figure 8 – Categories of Isolated Microorganisms in All Reported Cases (N = 147) and Cases Resulting in Death Within 30 Days (N = 16), Québec, 2015–2016 (%)
In 2015–2016, among VARBSI cases, 15.4% of S. aureus strains are oxacillin-resistant and no vancomycin-resistant Enterococcus was identified (Table 5 and Figure 9). An important increase in resistance to quinolones and to third-generation cephalosporins can be observed in enterobacteria, but no resistance to carbapenems is reported.
Tableau 5 – Percentage of Strains Tested and Percentage of Resistance to Antibiotics for Certain Isolated Microorganisms, Québec, 2015–2016 (N, %)
| Microorganism | Antibiotic | Isolated | Tested | Resistant | ||
|---|---|---|---|---|---|---|
N | N | % | N | % | ||
| Staphylococcus aureus | Oxacilline | 78 | 78 | 100.0 | 12 | 15.4 |
| Enterococcus | Vancomycine | 7 | 7 | 100.0 | 0 | 0.0 |
| Enterococcus faecalis | Vancomycine | 5 | 5 | 100.0 | 0 | 0.0 |
| Enterococcus faecium | Vancomycine | 2 | 2 | 100.0 | 0 | 0.0 |
| Klebsiella sp. | CSE 4 | 2 | 2 | 100.0 | 0 | 0.0 |
| Imipenem ou meropenem | 2 | 2 | 100.0 | 0 | 0.0 | |
| Multiresistant 1 | 2 | 2 | 100.0 | 0 | 0.0 | |
| Escherichia coli | CSE 4 | 5 | 5 | 100.0 | 2 | 40.0 |
| Fluoroquinolones 3 | 5 | 4 | 80.0 | 2 | 50.0 | |
| Imipenem ou meropenem | 5 | 3 | 60.0 | 0 | 0.0 | |
| Multiresistant 1 | 5 | 5 | 100.0 | 1 | 20.0 | |
| Enterobacter sp. | CSE 4 | 1 | 1 | 100.0 | 0 | 0.0 |
| Imipenem ou meropenem | 1 | 0 | 0.0 | 0 | - | |
| Multiresistant 1 | 1 | 1 | 100.0 | 0 | 0.0 | |
| Carbapenèmes | 1 | 1 | 100.0 | 0 | 0.0 | |
| Pseudomonas sp. | Amikacine. gentamicine ou tobramycine | 4 | 3 | 75.0 | 0 | 0.0 |
| CSE 2 | 4 | 4 | 100.0 | 0 | 0.0 | |
| Fluoroquinolones 2 | 4 | 4 | 100.0 | 0 | 0.0 | |
| Imipenem ou meropenem | 4 | 4 | 100.0 | 0 | 0.0 | |
| Piperacilline-tazobactam | 4 | 2 | 50.0 | 0 | 0.0 | |
| Multiresistant 2 | 4 | 4 | 100.0 | 0 | 0.0 | |
| Acinetobacter sp. | Imipenem ou meropenem | 0 | 0 | - | 0 | - |
| Multiresistant 3 | 0 | 0 | - | 0 | - | |
CSE 2 : cefepime or ceftazidime;
CSE 4: cefepime, cefotaxime, ceftazidime or ceftriaxone;
Fluoroquinolones 2: ciprofloxacin or levofloxacin;
Fluoroquinolones 3: ciprofloxacin, levofloxacin or moxifloxacin;
Multiresistant 1: intermediate or resistant to an agent in three of the following five categories: cephalosporins 4, fluoroquinolones 3, aminoglycosides, carbapenems, piperacillin or piperacillin/tazobactam.
Multiresistant 2: intermediate or resistant to an agent in three of the following five categories: cephalosporins 2, fluoroquinolones 2, aminoglycosides, carbapenems, piperacillin or piperacillin/tazobactam.
Multiresistant 3: intermediate or resistant to an agent in three of the following six categories: cephalosporins 2, fluoroquinolones 2, aminoglycosides, carbapenems, piperacillin or piperacillin/tazobactam, ampicillin/sulbactam.
Figure 9 – Percentage of Antibiotic Resistance in Certain Gram-Positive Bacteria, Certain Gram-Negative Bacteria and Pseudomonas sp., Québec, 2011-2012 to 2015–2016 (%)
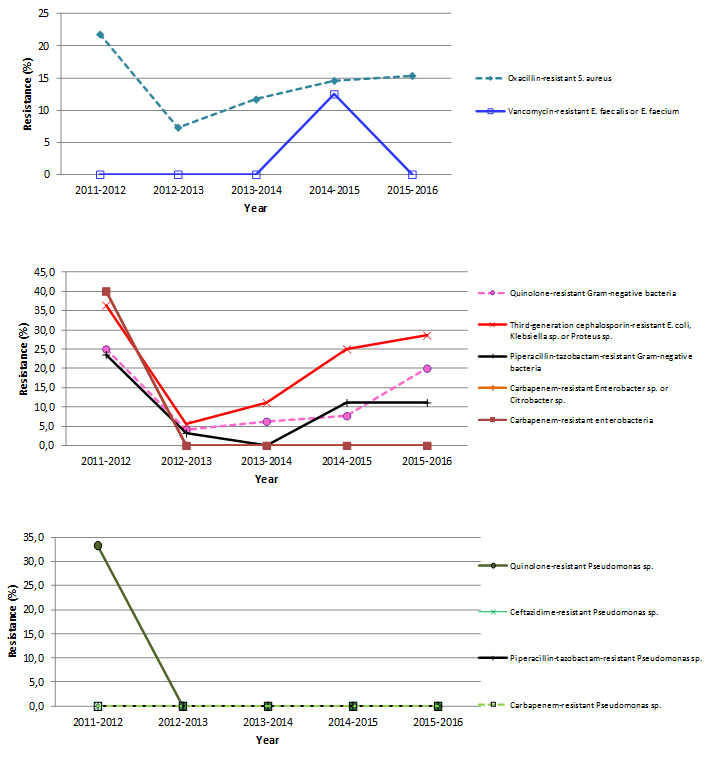
Note: Resistance proportion computations are based on small numbers, leading to a great volatility in results.
Results per healthcare facility
Figures 10 and 11 show the breakdown of patient-periods monitored in 2015–2016, by type of vascular access and by healthcare facility. In 2015–2016, the percentage of fistulas decreased in 13 healthcare facilities and increased in 7 (Table 6). Twelve facilities reported a rate of 0 VARBSI per 100 patient-periods, and five reported a rate higher than the 90th-percentile mark for 2011–2015 (Figure 12 and Table 7). Four of these five facilities have small dialysis units and declared only one or two VARBSIs in 2015-2016. Facilities with an incidence rate of 0 had small dialysis units of 5 to 11 chairs.
Figure 10 – Patient-periods Followed, by Healthcare Facility, Québec, 2015–2016 (%)
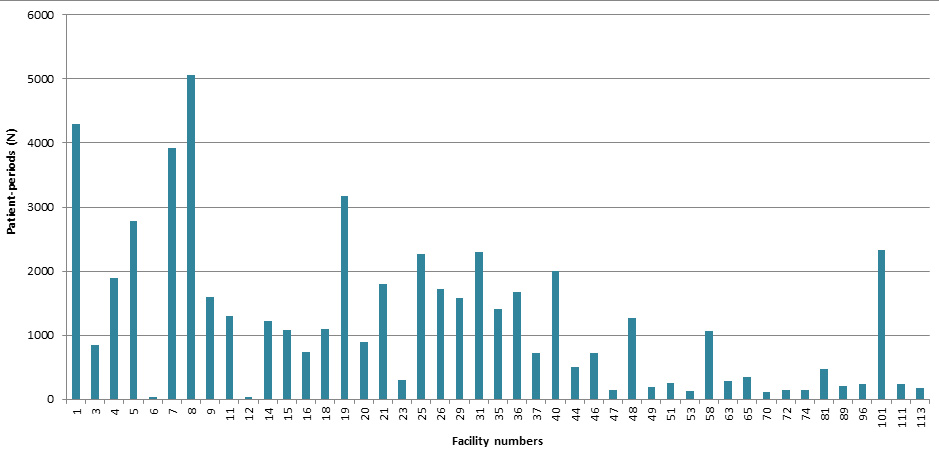
Figure 11 – Breakdown of Patient-periods Monitored by Type of Vascular Access and by Healthcare Facility, Québec, 2015–2016 (N)
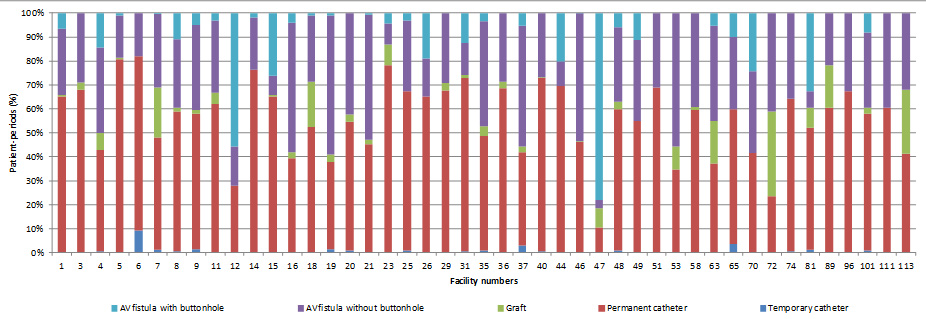
Figure 12 – VARBSI Incidence Rate per Healthcare Facility (2015–2016) and Incidence Rate Percentile (2011–2012 to 2014–2015), Québec, 2015–2016 (Incidence Rate per 100 Patient-periods)
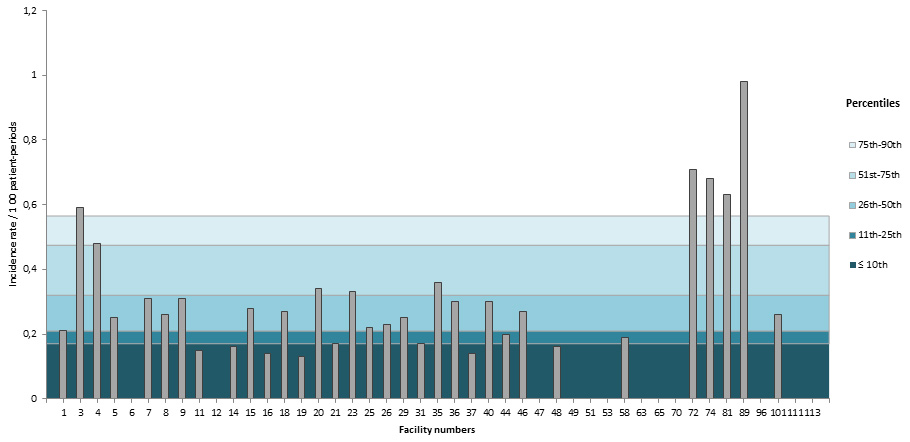
Table 6 – Number of Patient-periods Monitored and Percentage of Fistulas, by Healthcare Facility, Québec, 2011–2015 and 2015–2016 (N, % [95% CI])
| Facility | 2011-2015 | 2015-2016 | ||||
|---|---|---|---|---|---|---|
Patient-periods (n) | % with fistula | Patient-periods (n) | % with fistula | Variations | ||
| 1 | HÔPITAL CHARLES LEMOYNE | 16,185 | 41.3 [40.9 ; 41.6] | 4,293 | 34.8 [34.1 ; 35.5] | diminution |
| 3 | GLEN - ROYAL VICTORIA | 7,374 | 43.2 [42.7 ; 43.8] | 851 | 32.2 [30.6 ; 33.8] | diminution |
| 4 | HÔPITAL NOTRE-DAME DU CHUM | 9,377 | 64.2 [63.8 ; 64.7] | 1,893 | 57.2 [56.1 ; 58.3] | diminution |
| 5 | HÔPITAL GÉNÉRAL JUIF | 10,209 | 23.9 [23.4 ; 24.3] | 2,783 | 19.2 [18.5 ; 19.9] | diminution |
| 6 | GLEN - ENFANTS | 164 | 31.7 [28.1 ; 35.3] | 33 | 18.2 [11.6 ; 24.8] | |
| 7 | PAVILLON L'HÔTEL-DIEU DE QUÉBEC | 14,776 | 53.9 [53.5 ; 54.3] | 3,918 | 52.1 [51.3 ; 52.8] | diminution |
| 8 | PAVILLON MAISONNEUVE/PAVILLON MARCEL-LAMOUREUX | 19,273 | 46.7 [46.4 ; 47.1] | 5,065 | 41.2 [40.5 ; 41.8] | diminution |
| 9 | HÔPITAL DU HAUT-RICHELIEU | 5,884 | 44.1 [43.5 ; 44.7] | 1,591 | 42.0 [40.8 ; 43.2] | |
| 11 | HÔPITAL PIERRE-LE GARDEUR | 4,256 | 41.8 [41.1 ; 42.5] | 1,299 | 38.0 [36.6 ; 39.3] | diminution |
| 12 | CENTRE HOSPITALIER UNIVERSITAIRE SAINTE-JUSTINE | 230 | 14.3 [12.1 ; 16.6] | 43 | 72.1 [65.4 ; 78.8] | augmentation |
| 14 | CENTRE HOSPITALIER RÉGIONAL DE LANAUDIÈRE | 4,916 | 25.3 [24.7 ; 26.0] | 1,215 | 23.6 [22.4 ; 24.8] | |
| 15 | HÔPITAL FLEURIMONT | 5,198 | 30.8 [30.2 ; 31.5] | 1,088 | 34.9 [33.5 ; 36.3] | augmentation |
| 16 | HÔPITAL RÉGIONAL DE RIMOUSKI | 2,658 | 56.3 [55.4 ; 57.3] | 736 | 60.7 [59.0 ; 62.5] | augmentation |
| 18 | HÔTEL-DIEU DE LÉVIS | 4,168 | 46.7 [46.0 ; 47.5] | 1,101 | 47.5 [46.0 ; 49.0] | |
| 19 | HÔPITAL CITÉ DE LA SANTÉ | 11,618 | 66.3 [65.9 ; 66.7] | 3,173 | 62.1 [61.2 ; 62.9] | diminution |
| 20 | HÔPITAL DE CHICOUTIMI | 3,965 | 55.9 [55.1 ; 56.7] | 892 | 45.4 [43.8 ; 47.0] | diminution |
| 21 | HÔPITAL SAINT-LUC DU CHUM | 5,390 | 61.5 [60.9 ; 62.2] | 1,793 | 54.8 [53.7 ; 56.0] | diminution |
| 23 | HÔTEL-DIEU D'ARTHABASKA | 1,165 | 34.5 [33.1 ; 35.9] | 302 | 21.9 [19.5 ; 24.2] | diminution |
| 25 | HÔPITAL DU SACRÉ-COEUR DE MONTRÉAL | 9,320 | 29.6 [29.2 ; 30.1] | 2,268 | 32.6 [31.6 ; 33.5] | augmentation |
| 26 | HÔPITAL DE VERDUN | 6,530 | 47.0 [46.4 ; 47.6] | 1,716 | 34.7 [33.6 ; 35.9] | diminution |
| 29 | HÔPITAL GÉNÉRAL DE MONTRÉAL | 5,742 | 33.3 [32.7 ; 33.9] | 1,582 | 32.2 [31.1 ; 33.4] | |
| 31 | PAVILLON SAINTE-MARIE | 8,139 | 28.7 [28.2 ; 29.2] | 2,299 | 27.1 [26.2 ; 28.0] | |
| 35 | HÔPITAL HONORÉ-MERCIER | 4,243 | 52.8 [52.1 ; 53.6] | 1,404 | 51.4 [50.1 ; 52.7] | |
| 36 | HÔPITAL GÉNÉRAL DU LAKESHORE | 5,304 | 36.9 [36.2 ; 37.5] | 1,675 | 31.4 [30.3 ; 32.5] | diminution |
| 37 | HÔTEL-DIEU DE SOREL | 2,528 | 55.7 [54.7 ; 56.6] | 724 | 58.3 [56.5 ; 60.1] | |
| 40 | HÔPITAL DE HULL | 9,178 | 29.4 [28.9 ; 29.9] | 2,007 | 27.0 [26.0 ; 28.0] | diminution |
| 44 | HÔPITAL SAINTE-CROIX | 1,996 | 42.3 [41.2 ; 43.4] | 505 | 30.5 [28.5 ; 32.5] | diminution |
| 46 | HÔPITAL DE GRANBY | 2,509 | 53.4 [52.4 ; 54.3] | 729 | 53.8 [52.0 ; 55.6] | |
| 47 | HÔPITAL DE ROUYN-NORANDA | 687 | 68.0 [66.2 ; 69.7] | 145 | 89.7 [87.2 ; 92.1] | augmentation |
| 48 | CENTRE HOSPITALIER DE ST. MARY | 4,243 | 43.7 [42.9 ; 44.4] | 1,272 | 40.0 [38.7 ; 41.4] | diminution |
| 49 | CENTRE DE SANTÉ ET DE SERVICES SOCIAUX MEMPHRÉMAGOG | 761 | 47.2 [45.4 ; 48.9] | 195 | 45.1 [41.6 ; 48.6] | |
| 51 | HÔPITAL DE MANIWAKI | 809 | 36.0 [34.3 ; 37.6] | 247 | 31.2 [28.3 ; 34.1] | |
| 53 | HÔPITAL DE CHANDLER | 103 | 41.7 [37.0 ; 46.5] | 133 | 65.4 [61.4 ; 69.5] | augmentation |
| 58 | HÔPITAL DU SUROÎT | 4,186 | 54.7 [53.9 ; 55.4] | 1,069 | 40.4 [38.9 ; 41.9] | diminution |
| 63 | HÔPITAL DE SAINT-GEORGES | 576 | 49.7 [47.6 ; 51.7] | 286 | 62.9 [60.1 ; 65.7] | augmentation |
| 65 | HÔPITAL ET CLSC DE VAL-D'OR | 1,596 | 47.6 [46.4 ; 48.8] | 355 | 40.3 [37.7 ; 42.8] | diminution |
| 70 | CENTRE DE SOINS DE COURTE DURÉE LA SARRE | 444 | 58.3 [56.0 ; 60.6] | 111 | 58.6 [54.0 ; 63.1] | |
| 72 | HÔPITAL ET CENTRE D'HÉBERGEMENT DE SEPT-ÎLES | 434 | 58.1 [55.7 ; 60.4] | 141 | 76.6 [73.1 ; 80.1] | augmentation |
| 74 | HÔPITAL DE DOLBEAU-MISTASSINI | 251 | 37.5 [34.5 ; 40.4] | 148 | 35.8 [31.9 ; 39.7] | |
| 81 | HÔPITAL DE MONT-LAURIER | 1,595 | 51.7 [50.4 ; 52.9] | 473 | 48.0 [45.7 ; 50.2] | |
| 89 | HÔPITAL DE MONTMAGNY | 144 | 43.8 [39.7 ; 47.8] | 205 | 39.5 [36.2 ; 42.9] | |
| 96 | CENTRE DE SANTÉ DE CHIBOUGAMAU | 967 | 34.3 [32.8 ; 35.8] | 235 | 32.8 [29.8 ; 35.8] | |
| 101 | HÔPITAL RÉGIONAL DE SAINT-JÉRÔME | 9,281 | 44.4 [43.9 ; 44.9] | 2,335 | 42.1 [41.1 ; 43.1] | diminution |
| 111 | HÔPITAL DE PAPINEAU | 235 | 33.6 [30.6 ; 36.6] | 233 | 39.5 [36.3 ; 42.6] | |
| 113 | HÔPITAL DE THETFORD MINES | 599 | 59.3 [57.3 ; 61.2] | 184 | 58.7 [55.1 ; 62.3] |
|
| Québec | 209,206 | 44.4 [44.3 ; 44.6] | 54,745 | 41.0 [40.8 ; 41.2] | ||
Table 7 – Number of VARBSI Cases and Incidence Rate by Healthcare Facility, and Percentile Ranking, Québec, 2011–2015 and 2015–2016 (Incidence Rate per 100 Patient-periods [95% CI])
| Facility | 2011-2015 | 2015-2016 | ||||
|---|---|---|---|---|---|---|
Number of cases | Mean number of cases per year | Rate/100 pp | Number of cases | Rate/100 pp | ||
| 1 | HÔPITAL CHARLES LEMOYNE | 40 | 10 | 0.25 [0.18 ; 0.33] | 9 | 0.21 [0.10 ; 0.37] |
| 3 | GLEN - ROYAL VICTORIA | 42 | 10.5 | 0.57 [0.41 ; 0.76] | 5 | 0.59 [0.19 ; 1.22] |
| 4 | HÔPITAL NOTRE-DAME DU CHUM | 46 | 11.5 | 0.49 [0.36 ; 0.64] | 9 | 0.48 [0.22 ; 0.84] |
| 5 | HÔPITAL GÉNÉRAL JUIF | 17 | 4.3 | 0.17 [0.10 ; 0.26] | 7 | 0.25 [0.10 ; 0.47] |
| 6 | GLEN - ENFANTS | 0 | 0 | 0 | 0 | 0 |
| 7 | PAVILLON L'HÔTEL-DIEU DE QUÉBEC | 50 | 12.5 | 0.34 [0.25 ; 0.44] | 12 | 0.31 [0.16 ; 0.51] |
| 8 | PAVILLON MAISONNEUVE/PAVILLON MARCEL-LAMOUREUX | 74 | 18.5 | 0.38 [0.30 ; 0.47] | 13 | 0.26 [0.14 ; 0.42] |
| 9 | HÔPITAL DU HAUT-RICHELIEU | 18 | 4.5 | 0.31 [0.18 ; 0.47] | 5 | 0.31 [0.10 ; 0.64] |
| 11 | HÔPITAL PIERRE-LE GARDEUR | 24 | 6 | 0.56 [0.36 ; 0.81] | 2 | 0.15 [0.01 ; 0.43] |
| 12 | CENTRE HOSPITALIER UNIVERSITAIRE SAINTE-JUSTINE | 11 | 2.8 | 4.78 [2.37 ; 8.02] | 0 | 0 |
| 14 | CENTRE HOSPITALIER RÉGIONAL DE LANAUDIÈRE | 14 | 3.5 | 0.28 [0.15 ; 0.45] | 2 | 0.16 [0.01 ; 0.46] |
| 15 | HÔPITAL FLEURIMONT | 24 | 6 | 0.46 [0.29 ; 0.66] | 3 | 0.28 [0.05 ; 0.68] |
| 16 | HÔPITAL RÉGIONAL DE RIMOUSKI | 6 | 1.5 | 0.23 [0.08 ; 0.45] | 1 | 0.14 [0 ; 0.54] |
| 18 | HÔTEL-DIEU DE LÉVIS | 7 | 1.8 | 0.17 [0.07 ; 0.32] | 3 | 0.27 [0.05 ; 0.66] |
| 19 | HÔPITAL CITÉ DE LA SANTÉ | 28 | 7 | 0.24 [0.16 ; 0.34] | 4 | 0.13 [0.03 ; 0.29] |
| 20 | HÔPITAL DE CHICOUTIMI | 10 | 2.5 | 0.25 [0.12 ; 0.43] | 3 | 0.34 [0.07 ; 0.83] |
| 21 | HÔPITAL SAINT-LUC DU CHUM | 25 | 8.3 | 0.46 [0.30 ; 0.66] | 3 | 0.17 [0.03 ; 0.41] |
| 23 | HÔTEL-DIEU D'ARTHABASKA | 2 | 0.5 | 0.17 [0.02 ; 0.49] | 1 | 0.33 [0 ; 1.30] |
| 25 | HÔPITAL DU SACRÉ-COEUR DE MONTRÉAL | 50 | 12.5 | 0.54 [0.40 ; 0.70] | 5 | 0.22 [0.07 ; 0.46] |
| 26 | HÔPITAL DE VERDUN | 21 | 5.3 | 0.32 [0.20 ; 0.47] | 4 | 0.23 [0.06 ; 0.51] |
| 29 | HÔPITAL GÉNÉRAL DE MONTRÉAL | 26 | 6.5 | 0.45 [0.29 ; 0.64] | 4 | 0.25 [0.06 ; 0.56] |
| 31 | PAVILLON SAINTE-MARIE | 26 | 6.5 | 0.32 [0.21 ; 0.45] | 4 | 0.17 [0.04 ; 0.38] |
| 35 | HÔPITAL HONORÉ-MERCIER | 16 | 4 | 0.38 [0.22 ; 0.59] | 5 | 0.36 [0.11 ; 0.74] |
| 36 | HÔPITAL GÉNÉRAL DU LAKESHORE | 10 | 2.5 | 0.19 [0.09 ; 0.33] | 5 | 0.30 [0.10 ; 0.62] |
| 37 | HÔTEL-DIEU DE SOREL | 18 | 4.5 | 0.71 [0.42 ; 1.08] | 1 | 0.14 [0 ; 0.55] |
| 40 | HÔPITAL DE HULL | 27 | 6.8 | 0.29 [0.19 ; 0.41] | 6 | 0.30 [0.11 ; 0.59] |
| 44 | HÔPITAL SAINTE-CROIX | 7 | 1.8 | 0.35 [0.14 ; 0.66] | 1 | 0.20 [0 ; 0.78] |
| 46 | HÔPITAL DE GRANBY | 6 | 1.5 | 0.24 [0.09 ; 0.47] | 2 | 0.27 [0.02 ; 0.78] |
| 47 | HÔPITAL DE ROUYN-NORANDA | 1 | 0.3 | 0.15 [0 ; 0.58] | 0 | 0 |
| 48 | CENTRE HOSPITALIER DE ST. MARY | 8 | 2 | 0.19 [0.08 ; 0.34] | 2 | 0.16 [0.02 ; 0.46] |
| 49 | CENTRE DE SANTÉ ET DE SERVICES SOCIAUX MEMPHRÉMAGOG | 1 | 0.3 | 0.13 [0 ; 0.51] | 0 | 0 |
| 51 | HÔPITAL DE MANIWAKI | 3 | 0.8 | 0.37 [0.07 ; 0.91] | 0 | 0 |
| 53 | HÔPITAL DE CHANDLER | 0 | 0 | 0 | 0 | 0 |
| 58 | HÔPITAL DU SUROÎT | 8 | 2 | 0.19 [0.08 ; 0.34] | 2 | 0.19 [0.02 ; 0.54] |
| 63 | HÔPITAL DE SAINT-GEORGES | 1 | 0.3 | 0.17 [0 ; 0.67] | 0 | 0 |
| 65 | HÔPITAL ET CLSC DE VAL-D'OR | 9 | 2.3 | 0.56 [0.25 ; 0.99] | 0 | 0 |
| 70 | CENTRE DE SOINS DE COURTE DURÉE LA SARRE | 0 | 0 | 0 | 0 | 0 |
| 72 | HÔPITAL ET CENTRE D'HÉBERGEMENT DE SEPT-ÎLES | 1 | 0.3 | 0.23 [0 ; 0.90] | 1 | 0.71 [0 ; 2.78] |
| 74 | HÔPITAL DE DOLBEAU-MISTASSINI | 1 | 0.5 | 0.40 [0 ; 1.57] | 1 | 0.68 [0 ; 2.66] |
| 81 | HÔPITAL DE MONT-LAURIER | 2 | 0.5 | 0.13 [0.01 ; 0.37] | 3 | 0.63 [0.12 ; 1.55] |
| 89 | HÔPITAL DE MONTMAGNY | 0 | 0 | 0 | 2 | 0.98 [0.09 ; 2.80] |
| 96 | CENTRE DE SANTÉ DE CHIBOUGAMAU | 0 | 0 | 0 | 0 | 0 |
| 101 | HÔPITAL RÉGIONAL DE SAINT-JÉRÔME | 52 | 13 | 0.56 [0.42 ; 0.72] | 6 | 0.26 [0.09 ; 0.51] |
| 111 | HÔPITAL DE PAPINEAU | 2 | 2 | 0.85 [0.08 ; 2.44] | 0 | 0 |
| 113 | HÔPITAL DE THETFORD MINES | 3 | 1 | 0.50 [0.09 ; 1.23] | 0 | 0 |
| Québec | 737 | 188.9 | 0.35 [0.33 ; 0.38] | 136 | 0.25 [0.21 ; 0.29] | |
| Percentiles | ||||||
| 10th percentile | 0.17 | 0.15 | ||||
| 25th percentile | 0.21 | 0.19 | ||||
| 50th percentile | 0.32 | 0.26 | ||||
| 75th percentile | 0.48 | 0.33 | ||||
| 90th percentile | 0.57 | 0.63 | ||||
* Changes in rates within individual facilities were not subjected to statistical analysis, given the small number of cases involved.
References
- Fistula First. Graphs of Prevalent AV Fistula Use Rates, By Network [online]. http://www.fistulafirst.org/AboutFistulaFirst/FisultaFirstCatheterLastFFCLData.aspx (last consulted: 2013-08-06).
- Ayzac, L., Machut, A., Russell, I., et al. Rapport final pour l’année 2011 du réseau de surveillance des infections en hémodialyse – DIALIN. CClin Sud-Est and RAISIN [online]. http://cclin-sudest.chu-lyon.fr/Reseaux/DIALIN/Resultats/rapport_annuel_2011_V2.pdf (last consulted: 2013-08-06).
- Patel, P. R., Yi, S. H., Booth, S., et al. Bloodstream Infection Rates in Outpatient Hemodialysis Facilities Participating in a Collaborative Prevention Effort: A Quality Improvement Report. American Journal of Kidney Diseases, Vol. 62, No. 2 (August 2013), p. 322–330.
Author
Comité de surveillance provinciale des infections nosocomiales (SPIN) – bactériémies associées aux accès vasculaires en hémodialyse
Editorial Committee
Christophe Garenc, Direction des risques biologiques et de la santé au travail, Institut national de santé publique du Québec
Élise Fortin, Direction des risques biologiques et de la santé au travail, Institut national de santé publique du Québec
Charles Frenette, Centre universitaire de santé McGill
Danielle Moisan, Centre hospitalier régional du Grand-Portage
Muleka Ngenda-Muadi, Direction des risques biologiques et de la santé au travail, Institut national de santé publique du Québec
Isabelle Rocher, Direction des risques biologiques et de la santé au travail, Institut national de santé publique du Québec
Mélissa Trudeau, Direction des risques biologiques et de la santé au travail, Institut national de santé publique du Québec
Jasmin Villeneuve, Direction des risques biologiques et de la santé au travail, Institut national de santé publique du Québec