Hospital-Wide Healthcare-associated Bloodstream Infections: surveillance 2013-2014
 Hospital-Wide Healthcare-associated Bloodstream Infections
Surveillance results: 2013-2014
From April 1st, 2013, to March 31st, 2014, 77 healthcare facilities took part on a voluntary basis in the hospital-wide surveillance of bloodstream infections (BSIs), for a combined total of 4,149,763 patient-days (Table 1). Participating facilities reported 2,689 BSIs in 2,495 patients. The total incidence rate was 5.4 cases per 10,000 patient-days. The incidence rate in 2013-2014 was significantly lower compared with the average rate for 2009-2013 in facilities that took part in both surveillance periods. Two teaching and 11 non-teaching facilities that were not included in the 2012-2013 study joined the program in 2013-2014. Data was extracted on May 15th, 2014.
Update: March 9, 2017
Table 1 – Participation of Healthcare Facilities in the Hospital-Wide Surveillance of BSIs, Québec, 2009-2010 to 2013-2014
|
|
2009-2010 |
2010-2011 |
2011-2012 |
2012-2013 |
2013-2014 |
|---|---|---|---|---|---|
| Participating facilities (N) |
61 |
58 |
60 |
64 |
77 |
| Admissions (N) |
425,935 |
403,502 |
417,280 |
486,272 |
539,766 |
| Patient-days (N) |
3,407,223 |
3,259,186 |
3,275,332 |
3,797 385 |
4,149,763 |
| BSIs (cat. 1 and 2b, N) |
2,433 |
2,517 |
2,416 |
2,797 |
2,689 |
| Infected patients (N) |
2,298 |
2,346 |
2,303 |
2,674 |
2,495 |
Incidence Rates
In 2013-2014, the total incidence rate was 5.4 BSIs per 10,000 patient days. The incidence rates were much higher in intensive care units (ICUs) than in other units (Table 2). Catheter-related bloodstream infections (CRBSIs) were the most common BSIs in ICUs (Table 2 and Figure 2). In other units, the incidence rates varied depending on the type of healthcare facility: non-CRBSI were the most common primary BSIs in teaching facilities, while BSIs secondary to urinary tract infection were the most common in non-teaching facilities (Table 2 and Figure 3).
Figure 1 – BSI Incidence Rate for Each Type of Infection, by Type of Healthcare Facility, Québec, 2013-2014 (Incidence Rate per 10,000 Patient-Days [95% CI])
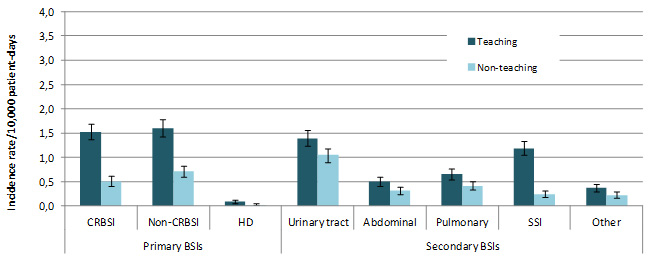
Figure 2 – BSI Incidence Rate in ICUs, For Each Type of Infection, by Type of Healthcare Facility and Type of ICU, Québec, 2013-2014 (Incidence Rate per 10,000 Patient-Days [95% CI])
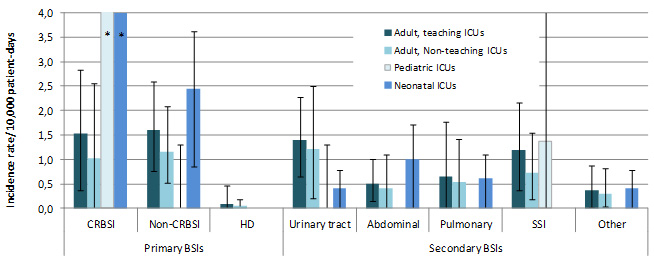
Figure 3 – BSI Incidence Rate in Non-ICU Units, for Each Type of Infection, by Type of Healthcare Facility, Québec, 2013-2014 (Incidence Rate per 10,000 Patient-Days [95% CI])
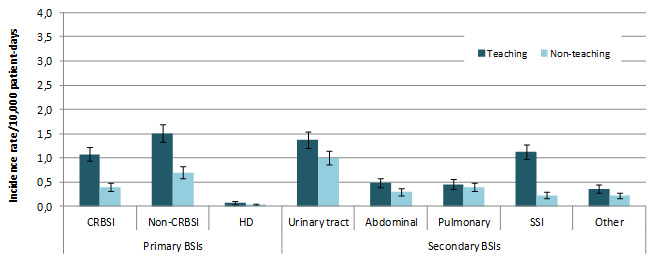
Table 2 – BSI Incidence Rate for Each Type of Infection, by Type of Healthcare Facility, Type of Unit and Type of ICU, Québec, 2012-2013 (Incidence Rate per 10,000 Patient-Days [95% CI])
|
|
Primary BSIs | Secondary BSIs |
Total |
|||||
|---|---|---|---|---|---|---|---|---|
| CRBSI | Non-CRBSI | Urinary tract | Abdominal | Pulmonary | SSI | Other** | ||
| Total hospitalized |
1.0 |
1.2 |
1.2 |
0.4 |
0.5 |
0.7 |
0.3 |
5.4 |
| Teaching |
1.5 |
1.6 |
1.4 |
0.5 |
0.6 |
1.2 |
0.4 |
7.3 |
| Non-teaching |
0.5 |
0.7 |
1.0 |
0.3 |
0.4 |
0.2 |
0.2 |
3.5 |
| ICUs |
5.5 |
2.2 |
1.8 |
0.7 |
2.2 |
1.6 |
0.5 |
14.7 |
| Adult teaching |
5.0 |
2.8 |
2.2 |
0.6 |
3.7 |
2.7 |
0.6 |
18.0 |
| Adult non-teaching |
3.6 |
1.1 |
2.4 |
0.6 |
1.0 |
0.9 |
0.3 |
9.8 |
| Pediatric |
12.3 |
0.0* |
0.0* |
0.0* |
0.0* |
1.4 |
0.0* |
13.6 |
| Neonatal |
8.5 |
2.4 |
0.4 |
1.0 |
0.6 |
0.0* |
0.4 |
13.4 |
| Non-ICU units |
0.7 |
1.1 |
1.2 |
0.4 |
0.4 |
0.7 |
0.3 |
4.8 |
| Teaching |
1.1 |
1.5 |
1.4 |
0.5 |
0.5 |
1.1 |
0.4 |
6.4 |
| Non-teaching |
0.4 |
0.7 |
1.0 |
0.3 |
0.4 |
0.2 |
0.2 |
3.3 |
* When the incidence rate is 0, the confidence interval [CI] is not calculated.
** The “Other” column also includes HD-related BSIs and secondary BSIs arising from a skin, soft tissue, bone or joint infection.
Incidence Rate Time Trends
The BSI incidence rate in 2013-2014 decreased significantly compared with the 2009-2013 pooled rate (p = 0.05, Table 3). This results from the significant decrease observed in teaching facilities (p < 0.01), while incidence rates remained stable in non-teaching facilities. This downward trend was observed for every BSI type except for non-CRBSIs and BSIs secondary to a SSI (Figure 4). Observed variations were significant for CRBSI (p < 0.01), non-CRBSI (p < 0.01) and BSIs secondary to abdominal (p = 0.04) or pulmonary infections (p < 0.01).
Figure 4 – BSI Incidence Rate, by Type of Infection, in Facilities that Previously participated in Surveillance (N = 64), Québec, 2009-2013 and 2013-2014 (Incidence Rate per 10,000 Patient-Days [95% CI])
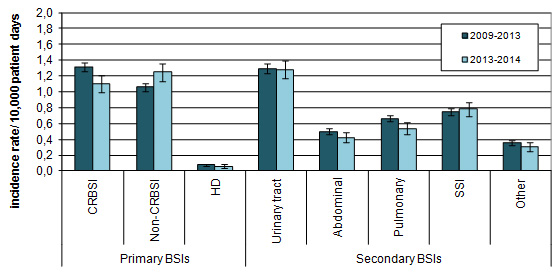
Table 3 – BSI Incidence Rate, by Type of Healthcare Facility, in Facilities that Previously participated in Surveillance (N = 64), Québec, 2009-2013 and 2013-2014 (Incidence Rate per 10,000 Patient-Days [95% CI])
|
Number of Facilities |
Incidence Rate |
||
|---|---|---|---|
|
2009-2013 |
2013-2014 |
||
| Teaching facilities |
22 |
8.2 [7.9 - 8.4] |
7.4 [7.0 - 7.8] |
| Non-teaching facilities |
42 |
3.7 [3.5 - 3.8] |
3.7 [3.4 - 4.0] |
|
Total |
64 |
6.0 [5.9 - 6.1] |
5.7 [5.5 - 6.0] |
Description of cases
Patients who developed a BSI were aged between 0 and 101 years, with a median age of 68 years. Although the incidence rates were higher in ICUs, most of the BSIs occurred in non-ICU units (70%, Table 4 and Figure 5). CRBSIs were the most commonly encountered BSIs in ICUs, whereas BSIs secondary to urinary tract infections were the most common in non-ICU units. Similarly, CRBSIs were the most frequent type of BSI in teaching facilities, whereas BSIs originating from a urinary tract infection ranked first among non-teaching facilities (Table 4 and Figure 6).
Figure 5 – Breakdown of Cases Based on Type of Unit and Type of ICU, Québec, 2013-2014 (%)
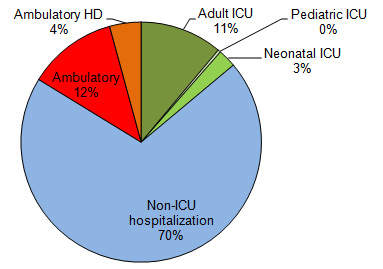
Figure 6 – Breakdown of Cases Based on Type of BSI, for Teaching and Non-Teaching Healthcare Facilities, Québec, 2013-2014 (%)
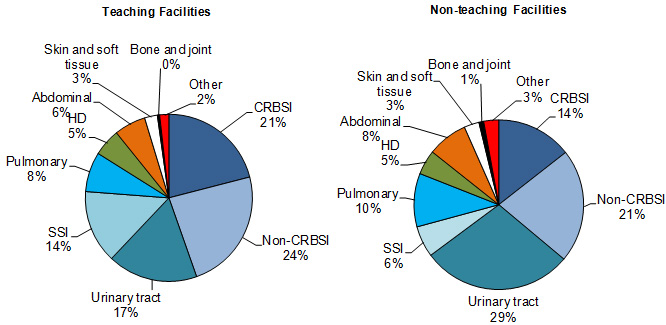
Table 4 – Number of Cases for Each Type of BSI, by Type of Healthcare Facility, Type of Unit and Type of ICU, Québec, 2013-2014 (N)
|
|
Primary BSIs | Secondary BSIs |
Total |
||||||
|---|---|---|---|---|---|---|---|---|---|
|
|
CRBSI |
Non-CRBSI |
HD |
Urinary tract | Abdominal | Pulmonary | SSI | Other** | |
|
Total |
507 |
618 |
137 |
568 |
178 |
229 |
309 |
143 |
2,689 |
| Teaching |
381 |
429 |
96 |
317 |
111 |
140 |
257 |
85 |
1,816 |
| Non-teaching |
126 |
189 |
41 |
251 |
67 |
89 |
52 |
58 |
873 |
| Total hospitalized |
426 |
483 |
23 |
506 |
169 |
222 |
300 |
123 |
2,252 |
| Teaching |
322 |
338 |
18 |
293 |
106 |
137 |
250 |
78 |
1,542 |
| Non-teaching |
104 |
145 |
5 |
213 |
63 |
85 |
50 |
45 |
710 |
| ICU |
140 |
56 |
4 |
47 |
17 |
57 |
41 |
12 |
374 |
| Adult, teaching |
64 |
36 |
4 |
28 |
8 |
47 |
34 |
8 |
229 |
| Adult, non-teaching |
25 |
8 |
0 |
17 |
4 |
7 |
6 |
2 |
69 |
| Pediatric |
9 |
0 |
0 |
0 |
0 |
0 |
1 |
0 |
10 |
| Neonatal |
42 |
12 |
0 |
2 |
5 |
3 |
0 |
2 |
66 |
| Non-ICU hospitalization |
286 |
427 |
19 |
459 |
152 |
165 |
259 |
111 |
1,878 |
| Teaching |
207 |
290 |
14 |
263 |
93 |
87 |
215 |
68 |
1,237 |
| Non-teaching |
79 |
137 |
5 |
196 |
59 |
78 |
44 |
43 |
641 |
| Ambulatory |
81 |
135 |
114 |
62 |
9 |
7 |
9 |
20 |
437 |
| Teaching |
59 |
91 |
78 |
24 |
5 |
3 |
7 |
7 |
274 |
| Non-teaching |
22 |
44 |
36 |
38 |
4 |
4 |
2 |
13 |
163 |
* The “Other” column also includes BSIs secondary to skin, soft tissue, bone or joint infection
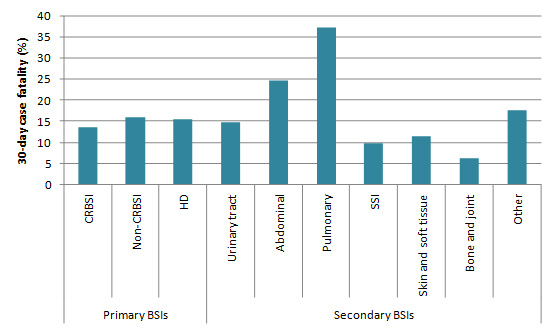
Overall, 17% of BSI cases resulted in death within 30 days of bacteremia onset (Table 5). Case fatality was highest in patients with a BSI secondary to a pulmonary infection (Table 5 and Figure 7).
Table 5 – 10-Day and 30-Day Case Fatality for Each Type of Infection, 2013-2014 (N, %)
|
|
BSIs | 10-day case fatality | 30-day case fatality | ||
|---|---|---|---|---|---|
|
|
N |
% |
N |
% |
|
| Primary BSIs | |||||
| CRBSI |
507 |
43 |
8 |
69 |
14 |
| Non-CRBSI |
618 |
60 |
10 |
99 |
16 |
| HD |
137 |
14 |
10 |
21 |
15 |
| Secondary BSIs | |||||
| Urinary tract |
568 |
43 |
8 |
84 |
15 |
| Abdominal |
178 |
30 |
17 |
44 |
25 |
| Pulmonary |
229 |
63 |
28 |
85 |
37 |
| SSI |
309 |
15 |
5 |
30 |
10 |
| Skin and soft tissue |
70 |
5 |
7 |
8 |
11 |
| Bone and joint |
16 |
0 |
0 |
1 |
6 |
| Other |
57 |
5 |
9 |
10 |
18 |
|
Total |
2,689 |
278 |
10 |
451 |
17 |
Figure 7 – 30-Day Case Fatality for Each Type of Infection, Québec, 2013-2014 (%)
Microbiology
The two most frequently isolated microorganisms in reported cases and in cases resulting in death within 30 days were Staphylococcus aureus and Escherichia coli (Figure 8 and Table 6). Staphylococcus aureus was the most frequently isolated microorganism in patients with a CRBSI, a dialysis-related BSI and in BSIs secondary to a SSI (Figure 9 and Table 6). In patients with a non-CRBSI or a BSI secondary to a urinary tract, pulmonary or abdominal infection, Enterobacteriaceae were the most common microorganisms. In cases of hemodialysis and BSIs secondary to a pulmonary infection or an SSI, S. aureus ranked first. A polymicrobial infection occurred in 7% of cases.
Figure 8 – Breakdown of Categories of Isolated Microorganisms in All Cases (N = 2,923) and Cases of Fatality Within 30 Days (N = 495), Québec, 2013-2014 (%)
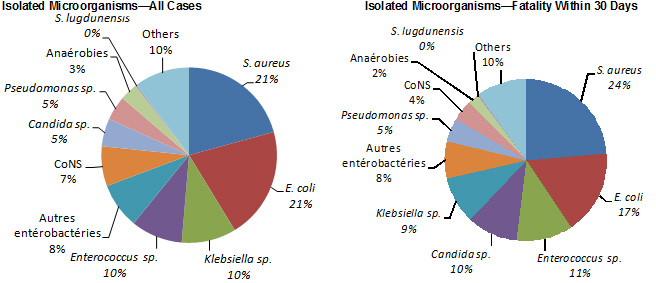
Figure 9 – Breakdown of Categories of Isolated Microorganisms, for Each Type of BSI, Québec, 2013-2014 (%)
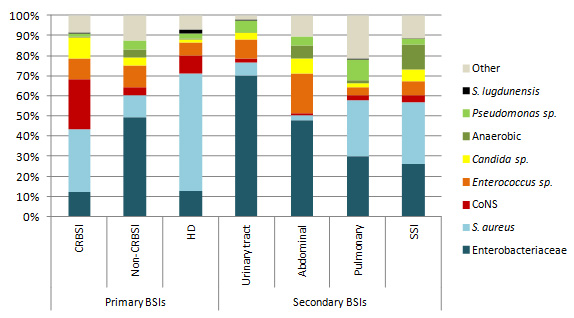
Table 6 – Breakdown of Microorganisms associated with BSIs, for each Type of BSI, for all BSIs and for those associated with a Fatality Within 30 Days, Québec, 2013-2014 (N, %)
|
Microorganism |
Primary BSIs |
Secondary BSIs |
Overall* |
30-Day Case Fatality |
|||||||
|---|---|---|---|---|---|---|---|---|---|---|---|
|
CRBSI |
Non-CRBSI |
HD |
Urinary tract |
Abdominal |
Pulmonary |
SSI |
N |
% |
|||
| Enterobacteria |
67 |
341 |
18 |
425 |
95 |
73 |
86 |
1,141 |
167 |
14.6 |
|
| E. coli |
12 |
179 |
2 |
279 |
46 |
26 |
40 |
601 |
84 |
14.0 |
|
| Klebsiella sp. |
24 |
93 |
3 |
79 |
34 |
31 |
21 |
294 |
46 |
15.6 |
|
| Other enterobacteriaceae |
31 |
69 |
13 |
67 |
15 |
16 |
25 |
246 |
37 |
15.0 |
|
| S. aureus |
174 |
78 |
83 |
38 |
5 |
68 |
103 |
606 |
117 |
19.3 |
|
| CNS |
139 |
26 |
13 |
13 |
2 |
6 |
12 |
215 |
21 |
9.8 |
|
| Enterococcus sp. |
59 |
75 |
9 |
54 |
39 |
10 |
23 |
278 |
56 |
20.1 |
|
| Candida sp. |
57 |
29 |
2 |
21 |
15 |
4 |
19 |
150 |
50 |
33.3 |
|
| Anaerobic |
2 |
28 |
1 |
2 |
12 |
4 |
41 |
95 |
10 |
10.5 |
|
| Pseudomonas sp. |
10 |
31 |
3 |
35 |
9 |
26 |
10 |
132 |
23 |
17.4 |
|
| S. lugdunensis |
2 |
0 |
3 |
2 |
0 |
1 |
1 |
9 |
2 |
22.2 |
|
| Other |
48 |
86 |
10 |
14 |
21 |
52 |
38 |
297 |
49 |
16.5 |
|
|
Total |
558 |
694 |
142 |
604 |
198 |
244 |
333 |
2,923 |
495 |
16.9 |
|
* This column includes the sum of the other columns as well as secondary BSIs arising from a skin, soft tissue, bone or joint infection, or another source.
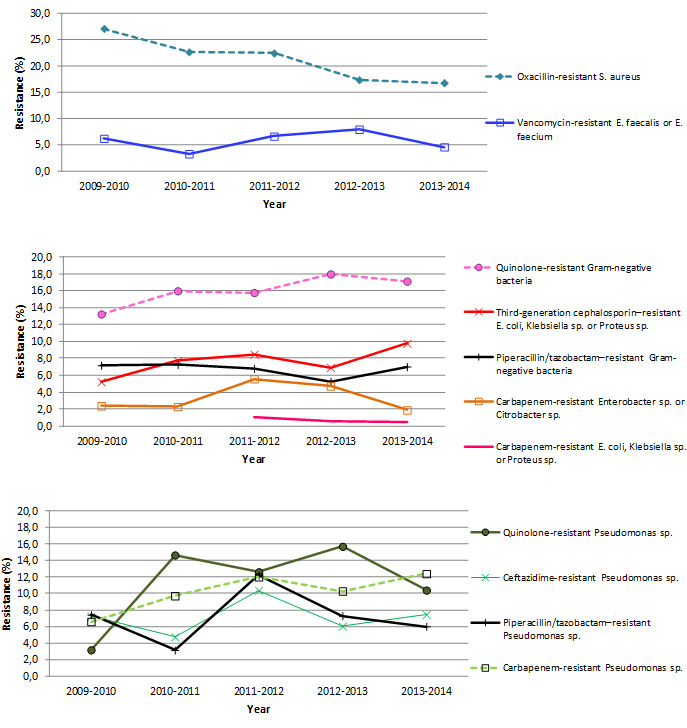
Methicillin-resistant S. aureus (MRSA) accounted for 17% (101/602) of S. aureus BSIs in all geographic areas. This proportion has been decreasing on a fairly constant basis since 2009 (Table 7 and Figure 10). Resistance to vancomycin was relatively stable in Enterococcus faecium and E. faecalis BSIs (5%), compared to 2009-2013. BSIs associated with carbapenem-resistant enterobacteriaceae continued to be relatively rare in Québec.
Table 7 – Proportion of Strains Tested and Proportion of Resistance to Antibiotics for Selected Isolated Microorganisms, Québec, 2013-2014 (N, %)
| Microorganism |
Antibiotic |
Isolated |
Tested |
Resistant |
||
|---|---|---|---|---|---|---|
|
N |
% |
N |
% |
|||
|
Staphylococcus aureus |
Oxacillin |
606 |
602 |
99.3 |
101 |
16.8 |
|
Enterococcus faecium |
Vancomycin |
78 |
78 |
100.0 |
10 |
12.8 |
|
Enterococcus faecalis |
Vancomycin |
142 |
141 |
99.3 |
0 |
0.0 |
|
Klebsiella (pneumoniae-oxytoca) |
CSE 4 |
8 |
7 |
87.5 |
0 |
0.0 |
| Imipenem or meropenem |
8 |
4 |
50.0 |
0 |
0.0 |
|
| Multiresistant 1 |
8 |
8 |
100.0 |
0 |
0.0 |
|
|
Escherichia coli |
CSE 4 |
601 |
507 |
84.4 |
68 |
13.4 |
| Fluoroquinolones 3 |
601 |
548 |
91.2 |
145 |
26.5 |
|
| Imipenem or meropenem |
601 |
163 |
27.1 |
0 |
- |
|
| Multiresistant 1 |
601 |
536 |
89.2 |
39 |
7.3 |
|
|
Enterobacter sp. |
CSE 4 |
133 |
110 |
82.7 |
16 |
14.5 |
| Imipenem or meropenem |
133 |
80 |
60.2 |
0 |
0.0 |
|
| Multiresistant 1 |
133 |
106 |
79.7 |
1 |
0.9 |
|
|
Pseudomonas sp. |
Amikacin, gentamicin or tobramycin |
132 |
109 |
82.6 |
4 |
3.7 |
| CSE 2 |
132 |
122 |
92.4 |
9 |
7.4 |
|
| Fluoroquinolones 2 |
132 |
125 |
94.7 |
13 |
10.4 |
|
| Imipenem or meropenem |
132 |
113 |
85.6 |
14 |
12.4 |
|
| Piperacillin/tazobactam |
132 |
100 |
75.8 |
6 |
6.0 |
|
| Multiresistant 2 |
132 |
126 |
95.5 |
9 |
7.1 |
|
|
Acinetobacter sp. |
Imipenem or meropenem |
13 |
6 |
46.2 |
0 |
0.0 |
| Multiresistant 3 |
13 |
6 |
46.2 |
0 |
0.0 |
|
CSE 4: cefepime, cefotaxime, ceftazidime or ceftriaxone; CSE 2: cefepime or ceftazidime.
Fluoroquinolones 3: ciprofloxacin, levofloxacin or moxifloxacin; Fluoroquinolones 2: ciprofloxacin or levofloxacin;
Multiresistant 1: intermediate or resistant to an agent in three of the following five categories: cephalosporins 4, fluoroquinolones 3, aminoglycosides, carbapenems, piperacillin or piperacillin/tazobactam.
Multiresistant 2: intermediate or resistant to an agent in three of the following five categories: cephalosporins 2, fluoroquinolones 2, aminoglycosides, carbapenems, piperacillin or piperacillin/tazobactam.
Multiresistant 3: intermediate or resistant to an agent in three of the following six categories: cephalosporins 2, fluoroquinolones 2, aminoglycosides, carbapenems, piperacillin or piperacillin/tazobactam, ampicillin/sulbactam.
Figure 10 – Antibiotic Resistance in Gram-Positive Bacteria, Gram-Negative Bacteria and Pseudomonas sp., Québec, 2009-2013 to 2013-2014 (%)
Results Per Healthcare Facility
The incidence rate distribution for teaching facilities decreased markedly compared to the background distribution from 2009-2010 to 2012-2013 (Table 8 and Figure 11). This is not the case in non-teaching facilities, despite the addition of 11 new healthcare facilities (Table 9 and Figure 12). We recommend that facilities compare their current rates with their own rates from previous years, as well as with figures reported by comparable facilities (teaching or non-teaching).
Figure 11 – BSI Incidence Rate per Facility (2013-2014) and Percentile Ranking (2009-2010 to 2012-2013) for Teaching Healthcare Facilities, Québec, 2013-2014
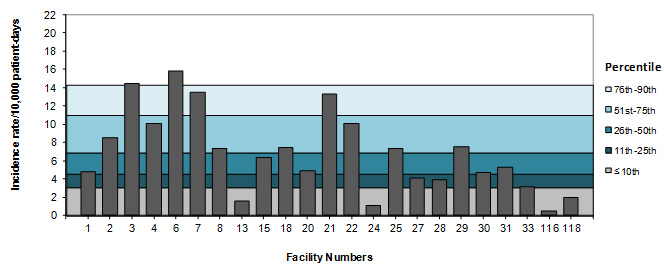
Figure 12 – BSI Incidence Rate per Facility (2013-2014) and Percentile Ranking (2009-2010 to 2012-2013) for Non-Teaching Healthcare Facilities, Québec, 2013-2014
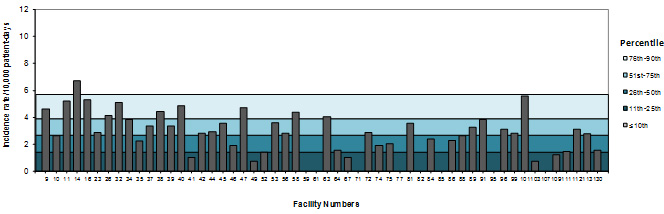
Table 8 – BSI Incidence Rate per Facility and Percentile Ranking, for Teaching Healthcare Facilities, Québec, 2009-2013 to 2013-2014 (Incidence Rate per 10,000 Patient-Days [95% CI])
|
Facility |
2009-2013 |
2013-2014 |
|||
|---|---|---|---|---|---|
|
1 |
HÔPITAL CHARLES LEMOYNE |
5.0 |
[4.4 - 5.6] |
4.8 |
[3.7 - 6.1] |
|
2 |
HÔPITAL DE L'ENFANT-JÉSUS |
8.8 |
[7.3 - 10.5] |
8.5 |
[7.0 - 10.2] |
|
3 |
HÔPITAL ROYAL VICTORIA |
14.5 |
[13.5 - 15.6] |
14.5 |
[12.4 - 16.8] |
|
4 |
HÔPITAL NOTRE-DAME DU CHUM |
11.9 |
[11.0 - 12.9] |
10.1 |
[8.4 - 12.0] |
|
6 |
L'HÔPITAL DE MONTRÉAL POUR ENFANTS |
13.6 |
[11.7 - 15.5] |
15.8 |
[11.9 - 20.3] |
|
7 |
PAVILLON L'HÔTEL-DIEU DE QUÉBEC |
12.0 |
[10.7 - 13.5] |
13.5 |
[11.2 - 16.1] |
|
8 |
PAV. MAISONNEUVE/PAV. MARCEL-LAMOUREUX |
8.2 |
[7.5 - 8.9] |
7.3 |
[6.1 - 8.6] |
|
13 |
INSTITUT DE CARDIOLOGIE DE MONTRÉAL |
- |
1.6 |
[0.6 - 3.1] |
|
|
15 |
HÔPITAL FLEURIMONT |
6.5 |
[5.8 - 7.3] |
6.4 |
[5.0 – 8.0] |
|
18 |
HÔTEL-DIEU DE LÉVIS |
8.0 |
[5.6 - 10.8] |
7.5 |
[5.1 - 10.3] |
|
20 |
HÔPITAL DE CHICOUTIMI |
3.5 |
[2.9 - 4.1] |
4.9 |
[3.6 - 6.5] |
|
21 |
HÔPITAL SAINT-LUC DU CHUM |
16.9 |
[15.6 - 18.2] |
13.4 |
[11.2 - 15.7] |
|
22 |
HÔTEL-DIEU DU CHUM |
10.0 |
[8.9 - 11.1] |
10.1 |
[8.0 - 12.4] |
|
24 |
HÔPITAL DU SAINT-SACREMENT |
1.6 |
[0.7 - 2.8] |
1.1 |
[0.4 - 2.1] |
|
25 |
HÔPITAL DU SACRÉ-COEUR DE MONTRÉAL |
7.6 |
[6.9 - 8.4] |
7.3 |
[6.0 - 8.8] |
|
27 |
PAVILLON CH DE L'UNIVERSITÉ LAVAL |
2.5 |
[1.9 - 3.1] |
4.1 |
[3.1 - 5.3] |
|
28 |
PAVILLON SAINT-FRANÇOIS D'ASSISE |
4.4 |
[3.6 - 5.2] |
4.0 |
[2.8 - 5.4] |
|
29 |
HÔPITAL GÉNÉRAL DE MONTRÉAL |
10.4 |
[9.5 - 11.4] |
7.5 |
[5.8 - 9.4] |
|
30 |
HÔTEL-DIEU DE SHERBROOKE |
5.8 |
[4.9 - 6.7] |
4.7 |
[3.2 - 6.5] |
|
31 |
PAVILLON SAINT-JOSEPH |
4.4 |
[3.8 - 5.0] |
5.3 |
[4.1 - 6.6] |
|
33 |
INSTITUT UNIVERSITAIRE DE CARDIOLOGIE ET DE PNEUMOLOGIE DE QUÉBEC |
4.8 |
[4.1 - 5.5] |
3.2 |
[2.1 - 4.4] |
|
116 |
INSTITUT THORACIQUE DE MONTRÉAL |
3.5 |
[2.4 - 4.8] |
0.5 |
[0.0 - 1.9] |
|
118 |
HÔPITAL NEUROLOGIQUE DE MONTRÉAL |
4.1 |
[2.9 - 5.5] |
2.0 |
[0.6 - 4.2] |
|
10th percentile |
3.1 |
1.7 |
|||
|
25th percentile |
4.6 |
1.4 |
|||
|
50th percentile |
6.9 |
2.8 |
|||
|
74th percentile |
11.0 |
3.8 |
|||
|
90th percentile |
14.3 |
4.8 |
|||
Table 9 – BSI Incidence Rate per Facility and Percentile Ranking, for Non-Teaching Healthcare Facilities, Québec, 2008-2012 to 2012-2013 (Incidence Rate per 10,000 Patient-Days [95% CI])
|
Facility |
2009-2013 |
2013-2014 |
|||
|---|---|---|---|---|---|
|
9 |
HÔPITAL DU HAUT-RICHELIEU |
6.5 |
[5.7 - 7.4] |
4.6 |
[3.3 - 6.1] |
|
10 |
HÔPITAL PIERRE-BOUCHER |
4.6 |
[3.7 - 5.6] |
2.6 |
[1.7 - 3.7] |
|
11 |
HÔPITAL PIERRE-LE GARDEUR |
3.4 |
[2.9 - 4.0] |
5.2 |
[3.9 - 6.7] |
|
14 |
CENTRE HOSPITALIER RÉGIONAL DE LANAUDIÈRE |
5.4 |
[4.6 - 6.2] |
6.7 |
[5.1 - 8.5] |
|
16 |
HÔPITAL RÉGIONAL DE RIMOUSKI |
5.8 |
[4.8 - 6.8] |
5.3 |
[3.5 - 7.5] |
|
23 |
HÔTEL-DIEU D'ARTHABASKA |
2.9 |
[2.2 - 3.6] |
2.9 |
[1.6 - 4.5] |
|
26 |
HÔPITAL DE VERDUN |
5.6 |
[4.8 - 6.5] |
4.1 |
[2.8 - 5.7] |
|
32 |
CENTRE HOSPITALIER RÉGIONAL DU GRAND-PORTAGE |
3.8 |
[2.8 - 4.9] |
5.1 |
[2.8 - 8.0] |
|
34 |
HÔPITAL SANTA CABRINI |
- |
3.9 |
[2.8 - 5.1] |
|
|
35 |
HÔPITAL HONORÉ-MERCIER |
- |
2.2 |
[1.2 - 3.5] |
|
|
37 |
HÔTEL-DIEU DE SOREL |
4.0 |
[3.2 - 5.0] |
3.3 |
[1.9 - 5.1] |
|
38 |
HÔPITAL JEAN-TALON |
6.1 |
[5.2 - 7.1] |
4.4 |
[2.8 - 6.4] |
|
39 |
HÔPITAL DE GATINEAU |
2.5 |
[1.9 - 3.2] |
3.3 |
[2.1 - 4.9] |
|
40 |
HÔPITAL DE HULL |
3.2 |
[2.6 - 3.9] |
4.9 |
[3.3 - 6.7] |
|
41 |
HÔPITAL DU CENTRE-DE-LA-MAURICIE |
2.6 |
[1.9 - 3.4] |
1.0 |
[0.3 - 2.1] |
|
42 |
HÔPITAL ANNA-LABERGE |
- |
2.8 |
[1.8 - 4.1] |
|
|
44 |
HÔPITAL SAINTE-CROIX |
3.3 |
[2.6 - 4.1] |
2.9 |
[1.7 - 4.4] |
|
45 |
HÔPITAL DE SAINT-EUSTACHE |
2.9 |
[2.3 - 3.5] |
3.5 |
[2.4 - 4.9] |
|
46 |
HÔPITAL DE GRANBY |
2.3 |
[1.7 - 3.1] |
1.9 |
[0.8 - 3.4] |
|
47 |
HÔPITAL DE ROUYN-NORANDA |
1.7 |
[1.0 - 2.6] |
4.7 |
[2.3 - 7.9] |
|
49 |
CSSS MEMPHRÉMAGOG |
- |
0.7 |
[0.0 - 2.8] |
|
|
52 |
CH HÔTEL-DIEU D'AMOS |
1.9 |
[1.1 - 2.8] |
1.4 |
[0.3 - 3.5] |
|
53 |
HÔPITAL DE CHANDLER |
3.7 |
[2.3 - 5.4] |
3.6 |
[1.1 - 7.5] |
|
56 |
CENTRE DE SANTÉ ET DE SERVICES SOCIAUX D'ARGENTEUIL |
- |
2.8 |
[0.3 - 8.1] |
|
|
58 |
HÔPITAL DU SUROÎT |
4.4 |
[3.6 - 5.3] |
4.4 |
[2.9 - 6.2] |
|
59 |
HÔPITAL DE BAIE-SAINT-PAUL |
- |
0.0 |
||
|
61 |
HÔPITAL NOTRE-DAME-DE-FATIMA |
1.0 |
[0.3 - 2.3] |
0.0 |
|
|
63 |
HÔPITAL DE SAINT-GEORGES |
3.1 |
[2.3 - 3.9] |
4.0 |
[2.3 - 6.2] |
|
64 |
HÔPITAL LE ROYER |
1.8 |
[1.1 - 2.7] |
1.5 |
[0.4 - 3.4] |
|
67 |
HÔPITAL ET CENTRE DE RÉADAPTATION DE JONQUIÈRE |
2.0 |
[1.4 - 2.8] |
1.0 |
[0.3 - 2.3] |
|
71 |
HÔPITAL DE MATANE |
0.6 |
[0.1 - 1.4] |
0.0 |
|
|
72 |
HÔPITAL ET CENTRE D'HÉBERGEMENT DE SEPT-ÎLES |
2.4 |
[1.4 - 3.8] |
2.9 |
[1.1 - 5.4] |
|
74 |
HÔPITAL DE DOLBEAU-MISTASSINI |
2.9 |
[1.8 - 4.3] |
1.9 |
[0.4 - 4.7] |
|
75 |
CSSS DU GRANIT |
- |
2.1 |
[0.2 - 5.9] |
|
|
77 |
HÔPITAL D'AMQUI |
1.9 |
[0.8 - 3.6] |
0.0 |
|
|
81 |
HÔPITAL DE MONT-LAURIER |
1.7 |
[0.9 - 2.9] |
3.5 |
[1.3 - 7.0] |
|
82 |
PAVILLON SAINTE-FAMILLE |
- |
0.0 |
||
|
84 |
HÔPITAL DE NOTRE-DAME-DU-LAC |
0.0 |
2.4 |
[0.2 - 6.8] |
|
|
85 |
CSSS DU HAUT-SAINT-MAURICE |
0.6 |
[0.1 - 1.9] |
0.0 |
|
|
86 |
HÔPITAL DE LA MALBAIE |
- |
2.3 |
[0.2 - 6.5] |
|
|
88 |
HÔPITAL. CLSC ET CENTRE D'HÉBERGEMENT DE ROBERVAL |
3.0 |
[2.1- 4.0] |
2.6 |
[1.1 - 4.8] |
|
89 |
HÔPITAL DE MONTMAGNY |
2.2 |
[1.3 - 3.3] |
3.2 |
[1.2 - 6.4] |
|
91 |
HÔPITAL HÔTEL-DIEU DE GASPÉ |
3.0 |
[1.6 - 4.8] |
3.9 |
[1.0 - 8.6] |
|
95 |
HÔPITAL DU PONTIAC |
0.0 |
|||
|
96 |
CENTRE DE SANTÉ DE CHIBOUGAMAU |
0.4 |
[0.0 - 1.4] |
3.1 |
[0.3 - 8.9] |
|
99 |
HÔPITAL BROME-MISSISQUOI-PERKINS |
3.6 |
[2.6 - 4.8] |
2.8 |
[1.2 - 5.1] |
|
101 |
HÔPITAL RÉGIONAL DE SAINT-JÉRÔME |
5.1 |
[4.4 - 5.8] |
5.6 |
[4.3 - 7.1] |
|
103 |
HÔPITAL LAURENTIEN |
1.2 |
[0.7 - 1.9] |
0.7 |
[0.1 - 2.1] |
|
107 |
HÔPITAL DE L'ARCHIPEL |
1.4 |
[0.1 - 3.9] |
0.0 |
|
|
109 |
HÔPITAL DE SAINTE-ANNE-DES-MONTS |
1.2 |
[0.3 - 2.7] |
1.2 |
[0.0 - 4.8] |
|
111 |
HÔPITAL DE PAPINEAU |
0.8 |
[0.3 - 1.5] |
1.5 |
[0.3 - 3.6] |
|
112 |
HÔPITAL D'ALMA |
3.0 |
[2.1 - 4.0] |
3.1 |
[1.5 - 5.3] |
|
113 |
HÔPITAL DE THETFORD MINES |
- |
2.8 |
[1.1 - 5.2] |
|
|
130 |
HÔPITAL BARRIE MEMORIAL |
- |
1.6 |
[0.1 - 4.5] |
|
|
|
10th percentile |
0.0 |
0.0 |
||
|
25th percentile |
1.4 |
1.4 |
|||
|
50th percentile |
2.7 |
2.8 |
|||
|
74th percentile |
3.9 |
3.8 |
|||
|
|
90th percentile |
5.7 |
4.8 |
||
Abbreviations
CRBSI: catheter-related bloodstream infection
HD: hemodialysis
95% CI: 95% confidence interval
SSI: surgical site infection
Non-CRBSI: non-catheter-related primary bloodstream infection
CoNS: coagulase-negative Staphylococcus
ICU: intensive care unit
Author
Comité de surveillance provinciale des infections nosocomiales (SPIN) – bactériémies panhospitalières
Editorial Committee
Alex Carignan, Centre hospitalier universitaire de Sherbrooke
Élise Fortin, Direction des risques biologiques et de la santé au travail, Institut national de santé publique du Québec
Muleka Ngenda-Muadi, Direction des risques biologiques et de la santé au travail, Institut national de santé publique du Québec
Isabelle Rocher, Direction des risques biologiques et de la santé au travail, Institut national de santé publique du Québec
Mélissa Trudeau, Direction des risques biologiques et de la santé au travail, Institut national de santé publique du Québec