Hospital-Wide Healthcare-associated Bloodstream Infections: surveillance 2015-2016
 Hospital-Wide Healthcare-associated Bloodstream Infections
Surveillance results: 2015-2016
From April 1st, 2015, to March 31st, 2016, 87 healthcare facilities took part in the hospital-wide surveillance of bloodstream infections (BSIs), for a combined total of 4,770,053 patient-days (Table 1). Participating facilities reported 3,173 BSIs in 2,948 patients. The total 2015-2016 incidence rate is 5.45 cases per 10,000 patient-days for all facilities participating in 2015-2016, and it is 5.35 for facilities that participated in 2015-2016 as well as in at least one year between 2011-2012 and 2014-2015. No non-catheter-related primary bloodstream infection (non-CRBSI) with a mucosal barrier injury (MBI) is observed in 2015-2016. The 2015-2016 incidence rate shows a decrease compared to the 2011-2015 incidence rate. A minimum of 11 periods of data are to be provided for facilities’ data to be included in this surveillance report. Data were extracted on May 31st, 2016.
Updated : March 3, 2017
Version française
Table 1—Participation of Healthcare Facilities in the Hospital-Wide Surveillance of BSIs, Québec, 2011–2012 to 2015–2016
|
|
2011-2012 |
2012-2013 |
2013-2014 |
2014-2015 |
2015-2016 |
|---|---|---|---|---|---|
| Participating facilities (N) |
59 |
64 |
73 |
89 |
87 |
| Admissions (N) |
409,435 |
482,354 |
520,772 |
633,252 |
649,388 |
| Patient-days (N) |
3,226,042 |
3,791,482 |
3,998,173 |
4,740,371 |
4,770,053 |
| BSIs (cat. 1a, 1b and 1c, N) |
2,250 |
2,683 |
2,457 |
3,021 |
3,173 |
| Infected patients (N) |
2,147 |
2,567 |
2,295 |
2,819 |
2,948 |
Incidence Rates
In 2015–2016, the total incidence rate is 5.45 BSIs per 10,000 patient-days. The incidence rates are much higher in intensive care units (ICUs) than in other units (Table 2), and they are higher in teaching compared to non-teaching facilities (Figure 1). Catheter-related bloodstream infections (CRBSIs) are the most common BSIs in ICUs (Table 2 and Figure 2). In other units, the incidence rates vary depending on the type of healthcare facility: non-CRBSI are the most common primary BSIs in teaching facilities, while BSIs secondary to urinary tract infections are the most common in non-teaching facilities (Table 2 and Figure 3).
Figure 1—BSI Incidence Rate for Each Type of Infection, by Type of Healthcare Facility, Québec, 2015–2016 (Incidence Rate per 10,000 Patient-Days [95% CI])
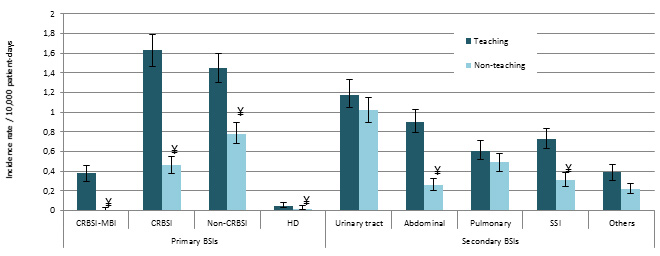
¥ Significant difference (p ˂ 0,05) between teaching and non-teaching facilities.
Figure 2—BSI Incidence Rate in ICUs, For Each Type of Infection, by Type of Healthcare Facility and Type of ICU, Québec, 2015–2016 (Incidence Rate per 10,000 Patient-Days [95% CI])
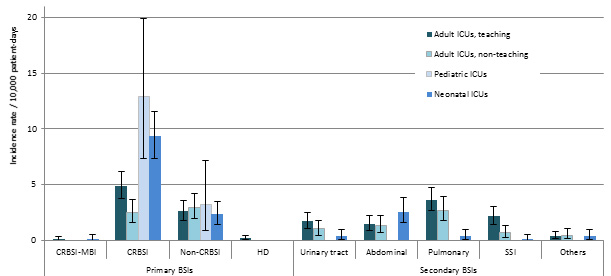
Figure 3—BSI Incidence Rate in Non-ICU Units, for Each Type of Infection, by Type of Healthcare Facility, Québec, 2015–2016 (Incidence Rate per 10,000 Patient-Days [95% CI])
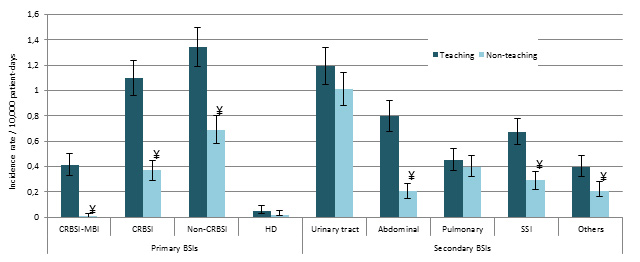
¥ Significant difference (p ˂ 0,05) between teaching and non-teaching facilities.
Table 2—BSI Incidence Rate for Each Type of Infection, by Type of Healthcare Facility, Type of Unit and Type of ICU, Québec, 2015–2016 (Incidence Rate per 10,000 Patient-Days [95% CI])
|
|
Primary BSIs |
Secondary BSIs |
Total |
|||||||
|---|---|---|---|---|---|---|---|---|---|---|
| CRBSI-MBI | CRBSI | Non-CRBSI | HD | Urinary tract | Abdominal | Pulmonary | SSI | Others** | ||
|
Total hospitalized |
0.20 [0.16 ; 0.24] |
1.05 [0.96 ; 1.14] |
1.12 [1.03 ; 1.22] |
0.03 [0.02 ; 0.05] |
1.10 [1.01 ; 1.20] |
0.58 [0.51 ; 0.65] |
0.55 [0.49 ; 0.62] |
0.52 [0.46 ; 0.59] |
0.31 [0.26 ; 0.36] |
5.45 [5.24 ; 5.66] |
| Teaching |
0.38 [0.31 ; 0.46] |
1.63 [1.47 ; 1.80] |
1.45 [1.30 ; 1.61] |
0.05 [0.03 ; 0.08] |
1.18 [1.05 ; 1.32] |
0.90 [0.78 ; 1.02] |
0.61 [0.52 ; 0.71] |
0.73 [0.63 ; 0.84] |
0.39 [0.31 ; 0.47] |
7.32 [6.98 ; 7.67] |
| Non-teaching |
0.01 [0 ; 0.03] |
0.46 [0.38 ; 0.55] |
0.78 [0.67 ; 0.90] |
0.02 [0.01 ; 0.04] |
1.02 [0.90 ; 1.15] |
0.26 [0.20 ; 0.33] |
0.49 [0.40 ; 0.58] |
0.31 [0.24 ; 0.38] |
0.22 [0.16 ; 0.28] |
3.56 [3.32 ; 3.80] |
|
ICUs |
0.06 [0 ; 0.18] |
5.64 [4.84 ; 6.51] |
2.64 [2.10 ; 3.24] |
0.06 [0 ; 0.18] |
1.09 [0.75 ; 1.49] |
1.67 [1.25 ; 2.16] |
2.38 [1.87 ; 2.95] |
1.13 [0.79 ; 1.53] |
0.39 [0.20 ; 0.64] |
15.07 [13.74 ; 16.47] |
| Adult teaching |
0.08 [0 ; 0.31] |
4.89 [3.77 ; 6.16] |
2.60 [1.80 ; 3.55] |
0.15 [0.01 ; 0.43] |
1.68 [1.05 ; 2.46] |
1.45 [0.87 ; 2.18] |
3.59 [2.64 ; 4.69] |
2.14 [1.42 ; 3.01] |
0.38 [0.12 ; 0.79] |
16.95 [14.79 ; 19.25] |
| Adult non-teaching |
0 |
2.48 [1.55 ; 3.62] |
2.93 [1.91 ; 4.16] |
0 |
1.01 [0.46 ; 1.78] |
1.35 [0.69 ; 2.22] |
2.70 [1.73 ; 3.89] |
0.68 [0.25 ; 1.33] |
0.45 [0.12 ; 1.00] |
11.60 [9.47 ; 13.95] |
| Pediatric |
0 |
12.88 [7.34 ; 19.96] |
3.22 [0.84 ; 7.15] |
0 |
0 |
0 |
0 |
0 |
0 |
16.91 [10.45 ; 24.91] |
| Neonatal |
0.13 [0 ; 0.51] |
9.32 [7.30 ; 11.58] |
2.30 [1.36 ; 3.48] |
0 |
0.38 [0.07 ; 0.93] |
2.55 [1.55 ; 3.79] |
0.38 [0.07 ; 0.93] |
0.13 [0 ; 0.51] |
0.38 [0.07 ; 0.93] |
15.58 [12.94 ; 18.47] |
|
Non-ICU units |
0.21 [0.17 ; 0.25] |
0.73 [0.65 ; 0.81] |
1.01 [0.92 ; 1.11] |
0.03 [0.02 ; 0.05] |
1.10 [1.00 ; 1.20] |
0.50 [0.44 ; 0.57] |
0.42 [0.36 ; 0.48] |
0.48 [0.42 ; 0.55] |
0.30 [0.25 ; 0.35] |
4.78 [4.58 ; 4.98] |
| Teaching |
0.41 [0.33 ; 0.50] |
1.10 [0.97 ; 1.24] |
1.34 [1.19 ; 1.50] |
0.05 [0.02 ; 0.08] |
1.19 [1.05 ; 1.34] |
0.80 [0.69 ; 0.92] |
0.45 [0.37 ; 0.54] |
0.67 [0.57 ; 0.78] |
0.40 [0.32 ; 0.49] |
6.42 [6.09 ; 6.76] |
| Non-teaching |
0.01 [0 ; 0.03] |
0.37 [0.30 ; 0.45] |
0.69 [0.59 ; 0.80] |
0.02 [0.01 ; 0.04] |
1.01 [0.88 ; 1.14] |
0.21 [0.15 ; 0.27] |
0.40 [0.32 ; 0.49] |
0.29 [0.22 ; 0.36] |
0.21 [0.15 ; 0.27] |
3.22 [2.99 ; 3.45] |
Note: When the incidence rate is 0, the confidence interval [CI] is not calculated.
** The “Others” column also includes secondary BSIs arising from a skin, soft tissue, bone or joint infection.
Incidence Rate Time Trend
The BSI incidence rate in 2015–2016 decreased compared with the 2011–2015 pooled rate (Table 3). This decrease was driven by certain types of bloodstream infections (Figure 4). The most important decreases in incidence rates are observed in BSIs secondary to urinary tract infections and to surgical site infections (SSIs).
Figure 4 - BSI Incidence Rate, by Type of Infection, in Facilities that Previously participated in Surveillance (N = 86) 1, Québec, 2011–2015 and 2015–2016 (Incidence Rate per 10,000 Patient-Days [95% CI])*, Québec, 2011–2015 and 2015–2016 (Incidence Rate per 10,000 Patient-Days [95% CI])
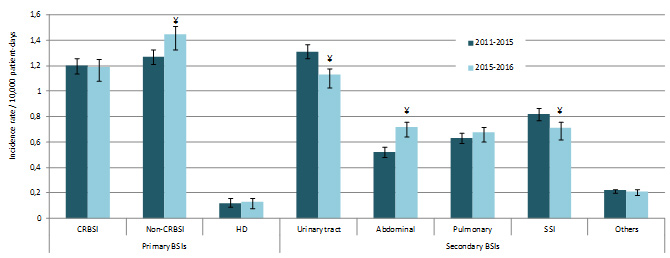
¥ Significant difference (p ˂ 0,05) between 2011-2015 and 2015-2016.
Table 3—BSI Incidence Rate, by Type of Healthcare Facility, in Facilities that Previously participated in Surveillance (N = 86)*, Québec, 2011–2015 and 2015–2016 (Incidence Rate per 10,000 Patient-Days [95% CI])
|
Facilities |
Number of Facilities |
Incidence Rate |
|
|---|---|---|---|
|
2011-2015 |
2015-2016 |
||
| Teaching |
25 |
7.49 [7.30 ; 7.68] |
7.26 [6.91 ; 7.62] |
| Non-teaching |
61 |
3.64 [3.51 ; 3.78] |
3.56 [3.32 ; 3.80] |
|
Total |
86 |
5.57 [5.46 ; 5.69] |
5.35 [5.14 ; 5.56] |
* Analyses performed on data from facilities that participated in 2015-2016 as well as in at least one year between 2011-2012 and 2014-2015.
Description of cases
Although the incidence rates are higher in ICUs, most BSIs occurred in non-ICU units (67.2%, Table 4 and Figure 5), where 93% of patient-days are counted (n = 4,459,543 patient-days). CRBSIs are the most commonly encountered BSIs in ICUs, whereas BSIs secondary to urinary tract infections are the most common in non-ICU units.
Figure 5 – Breakdown of Cases Based on Type of Unit and Type of ICU, Québec, 2015–2016 (%)
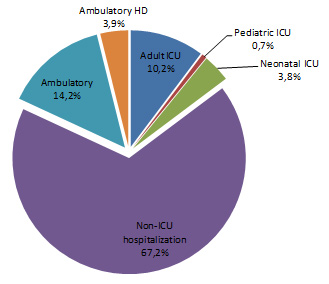
Figure 6 - Breakdown of Cases Based on Type of BSI, for Teaching and Non-Teaching Healthcare Facilities, Québec, 2015–2016 (%)
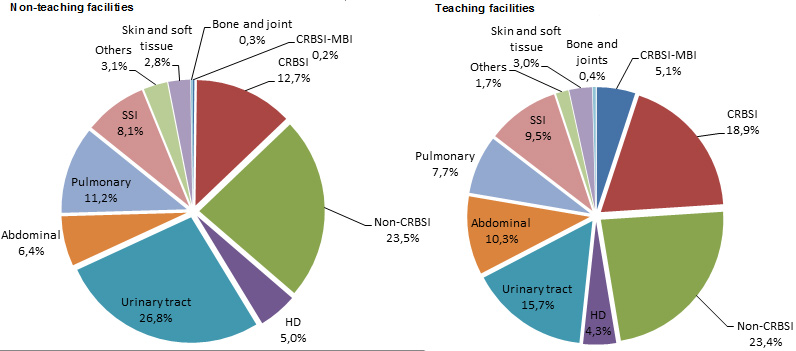
Table 4 - Number of Cases for Each Type of BSI, by Type of Healthcare Facility, Type of Unit and Type of ICU, Québec, 2015–2016 (N)
|
|
Primary BSIs |
Secondary BSIs |
Total |
|||||||
|---|---|---|---|---|---|---|---|---|---|---|
| CRBSI-MBI | CRBSI | Non-CRBSI | HD | Urinary tract | Abdominal | Pulmonary | SSI | Others* | ||
| Total hospitalized |
94 |
500 |
532 |
16 |
524 |
276 |
263 |
248 |
146 |
2 599 |
| Teaching |
92 |
391 |
348 |
12 |
282 |
215 |
146 |
175 |
94 |
1 755 |
| Non-teaching |
2 |
109 |
184 |
4 |
242 |
61 |
117 |
73 |
52 |
844 |
| ICU |
2 |
175 |
82 |
2 |
34 |
52 |
74 |
35 |
12 |
468 |
| Adult, teaching |
1 |
64 |
34 |
2 |
22 |
19 |
47 |
28 |
5 |
222 |
| Adult, non-teaching |
0 |
22 |
26 |
0 |
9 |
12 |
24 |
6 |
4 |
103 |
| Pediatric |
0 |
16 |
4 |
0 |
0 |
1 |
0 |
0 |
0 |
21 |
| Neonatal |
1 |
73 |
18 |
0 |
3 |
20 |
3 |
1 |
3 |
122 |
| Non-ICU hospitalization |
92 |
325 |
450 |
14 |
490 |
224 |
189 |
213 |
134 |
2 131 |
| Teaching |
90 |
240 |
292 |
10 |
259 |
175 |
98 |
146 |
87 |
1 397 |
| Non-teaching |
2 |
85 |
158 |
4 |
231 |
49 |
91 |
67 |
47 |
734 |
* The "Others" column also includes BSIs secondary to skin, soft tissue, bone or joint infection.
Overall, 17.8% of BSI cases resulted in death within 30 days of bacteremia onset (Table 5). Case fatality is highest in patients with a BSI secondary to a pulmonary infection (Table 5).
Figure 7 - 30-Day Case Fatality for Each Type of Infection, Québec, 2015–2016 (%)
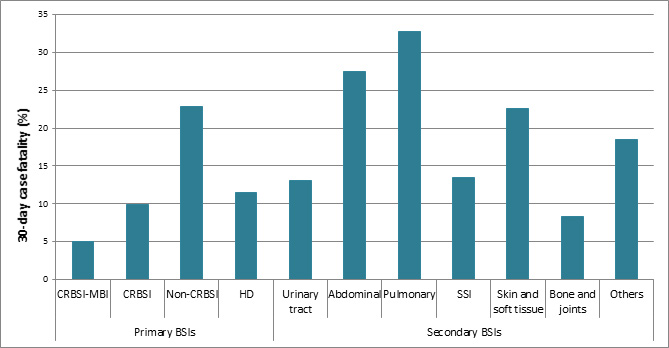
Table 5 - 10-Day and 30-Day Case Fatality for Each Type of Infection, 2015–2016 (N, %)
|
|
BSIs |
10-day case fatality |
30-day case fatality |
||
|---|---|---|---|---|---|
|
(N) |
N |
% |
N |
% |
|
| Primary BSIs | |||||
| CRBSI-MBI |
101 |
2 |
2.0 |
5 |
5.0 |
| CRBSI |
603 |
33 |
5.5 |
60 |
10.0 |
| Non-CRBSI |
728 |
119 |
16.3 |
166 |
22.8 |
| HD |
139 |
9 |
6.5 |
16 |
11.5 |
| Secondary BSIs | |||||
| Urinary tract |
597 |
45 |
7.5 |
78 |
13.1 |
| Abdominal |
291 |
59 |
20.3 |
80 |
27.5 |
| Pulmonary |
269 |
60 |
22.3 |
88 |
32.7 |
| SSI |
275 |
19 |
6.9 |
37 |
13.5 |
| Skin and soft tissues |
93 |
13 |
14.0 |
21 |
22.6 |
| Bone and joints |
12 |
1 |
8.3 |
1 |
8.3 |
| Others |
65 |
9 |
13.8 |
12 |
18.5 |
|
Total |
3,173 |
369 |
11.6 |
564 |
17.8 |
Microbiology
Escherichia coli is the most frequently isolated microorganism in reported cases (22% of BSIs, Table 6). Candida sp. and Pseudomonas sp. are the microorganisms associated with the higher case fatality. Staphylococcus aureus is the most frequently isolated microorganism in CRBSI, hemodialysis-related BSIs and in BSIs secondary to a pulmonary infection or a SSI. In patients with a non-CRBSI, CRBSI-MBI or a BSI secondary to a urinary tract or abdominal infection, enterobacteria are the most common microorganisms.
Figure 8 – Breakdown of Categories of Isolated Microorganisms in All Cases (N = 3,501) and Cases of Fatality Within 30 Days (N = 645), Québec, 2015–2016 (%)
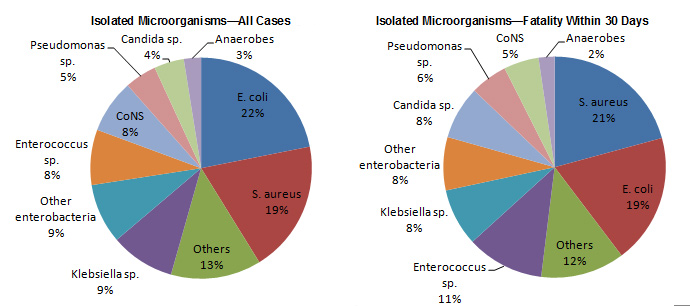
Figure 9 – Breakdown of Categories of Isolated Microorganisms, for Each Type of BSI, Québec, 2015–2016 (%)
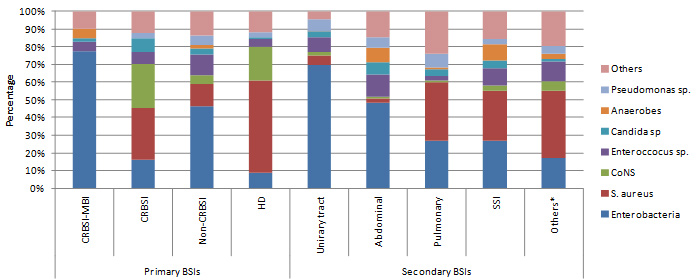
* This column includes the sum of the other columns as well as secondary BSIs arising from a skin, soft tissue, bone or joint infection, or another source.
Tableau 6 – Breakdown of Microorganisms associated with BSIs, for each Type of BSI, for all BSIs and for those associated with a Fatality Within 30 Days, Québec, 2015–2016 (N, %)
|
Microorganism |
Primary BSIs |
Secondary BSIs |
Total |
30-day Case Fatality |
||||||||
|---|---|---|---|---|---|---|---|---|---|---|---|---|
| CRBSI – MBI | CRBSI | Non-CRBSI | HD | Urinary tract | Abdominal | Pulmonary | ISO | Others* |
n |
% |
||
| Enterobacteria |
86 |
108 |
369 |
13 |
442 |
166 |
80 |
83 |
31 |
1 378 |
226 |
16.4 |
| E. coli |
39 |
22 |
219 |
5 |
298 |
95 |
29 |
42 |
17 |
766 |
122 |
15.9 |
| Klebsiella sp. |
33 |
35 |
89 |
2 |
83 |
37 |
25 |
17 |
8 |
329 |
54 |
16.4 |
| Other enterobacteriaceae |
14 |
51 |
61 |
6 |
61 |
34 |
26 |
24 |
6 |
283 |
50 |
17.7 |
| S. aureus |
0 |
199 |
100 |
79 |
33 |
9 |
99 |
87 |
70 |
676 |
134 |
19.8 |
| CoNS |
0 |
168 |
41 |
29 |
13 |
2 |
2 |
9 |
10 |
274 |
33 |
12.0 |
| Enterococcus sp. |
6 |
45 |
93 |
6 |
54 |
45 |
8 |
30 |
20 |
307 |
73 |
23.8 |
| Candida sp. |
2 |
53 |
26 |
2 |
20 |
22 |
12 |
13 |
3 |
153 |
50 |
32.7 |
| Anaerobic |
6 |
0 |
15 |
0 |
1 |
29 |
3 |
29 |
5 |
88 |
15 |
17.0 |
| Pseudomonas sp. |
0 |
18 |
42 |
4 |
41 |
20 |
22 |
8 |
8 |
163 |
35 |
21.5 |
| Others |
11 |
84 |
111 |
18 |
30 |
51 |
72 |
49 |
36 |
462 |
79 |
17.1 |
|
Total |
111 |
675 |
797 |
151 |
634 |
344 |
298 |
308 |
183 |
3 501 |
645 |
18.4 |
* This column includes the sum of the other columns as well as secondary BSIs arising from a skin, soft tissue, bone or joint infection, or another source.
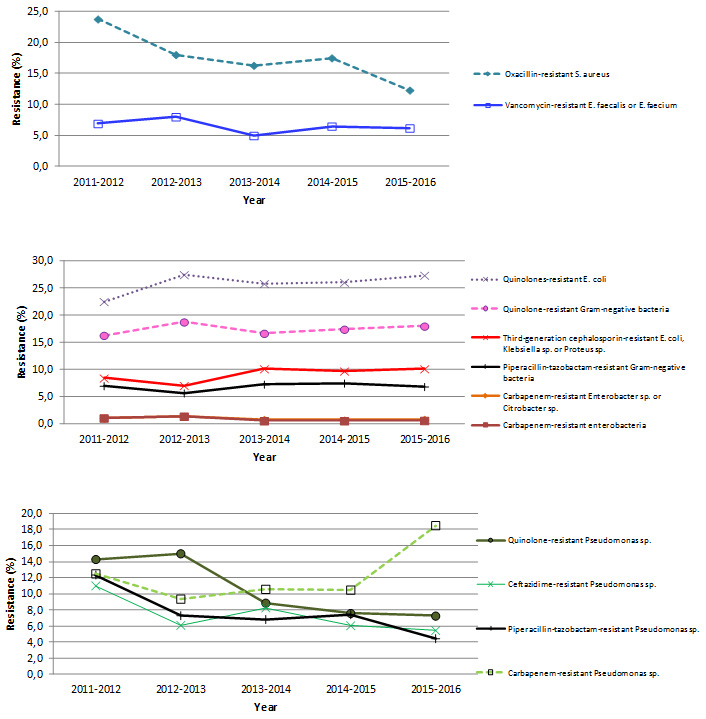
Methicillin-resistant S. aureus (MRSA) accounted for 12.3% (83 / 676) of S. aureus BSIs in all healthcare units (Table 7 and Figure 10).
Table 7 – Proportion of Strains Tested and Proportion of Resistance to Antibiotics for Selected Isolated Microorganisms, Québec, 2015–2016 (N, %)
|
Microorganism |
Antibiotic |
Isolated |
Tested |
Resistant |
||
|---|---|---|---|---|---|---|
|
N |
N |
% |
N |
% |
||
|
Staphylococcus aureus |
Oxacilline |
676 |
676 |
100.0 |
83 |
12.3 |
|
Enterococcus |
Vancomycine |
261 |
260 |
99.6 |
16 |
6.2 |
|
Enterococcus faecalis |
Vancomycine |
157 |
156 |
99.4 |
0 |
0.0 |
|
Enterococcus faecium |
Vancomycine |
104 |
104 |
100.0 |
16 |
15.4 |
|
Klebsiella sp. |
CSE 4 |
315 |
295 |
93.7 |
18 |
6.1 |
|
Imipenem or meropenem |
315 |
207 |
65.7 |
0 |
0.0 |
|
|
Multiresistant 1 |
315 |
310 |
98.4 |
8 |
2.6 |
|
|
Escherichia coli |
CSE 4 |
728 |
607 |
83.4 |
78 |
12.9 |
|
Fluoroquinolones 3 |
728 |
666 |
91.5 |
182 |
27.3 |
|
|
Imipenem or méropenem |
728 |
457 |
62.8 |
0 |
0.0 |
|
|
Multiresistant 1 |
728 |
673 |
92.4 |
27 |
4.0 |
|
|
Enterobacter sp. |
CSE 4 |
112 |
107 |
95.5 |
28 |
26.2 |
|
Imipenem or meropenem |
112 |
87 |
77.7 |
2 |
2.3 |
|
|
Multiresistant 1 |
112 |
107 |
95.5 |
0 |
0.0 |
|
|
Carbapénèmes |
112 |
98 |
87.5 |
4 |
4.1 |
|
|
Pseudomonas sp. |
Amikacine. gentamicine ou tobramycine |
157 |
129 |
82.2 |
8 |
6.2 |
|
CSE 2 |
157 |
147 |
93.6 |
9 |
6.1 |
|
|
Fluoroquinolones 2 |
157 |
152 |
96.8 |
11 |
7.2 |
|
|
Imipénem ou méropénem |
157 |
146 |
93.0 |
27 |
18.5 |
|
|
Pipéracilline-tazobactam |
157 |
113 |
72.0 |
5 |
4.4 |
|
|
Multirésistant 2 |
157 |
155 |
98.7 |
9 |
5.8 |
|
|
Acinetobacter sp. |
Imipénem ou méropénem |
12 |
12 |
100.0 |
0 |
0.0 |
|
Multirésistant 3 |
12 |
5 |
41.7 |
0 |
0.0 |
|
CSE 4 : cefepime, cefotaxime, ceftazidime or ceftriaxone;
CSE 2 : cefepime or ceftazidime;
Fluoroquinolones 2 : ciprofloxacin ou levofloxacin;
Fluoroquinolones 3 : ciprofloxacin, levofloxacin or moxifloxacine;
Multiresistant 1 : intermediate or resistant to an agent in three of the following five categories: cephalosporins 4, fluoroquinolones 3, aminoglycosides, carbapenems, piperacillin or piperacillin/tazobactam;
Multiresistant 2 : intermediate or resistant to an agent in three of the following five categories: cephalosporins 2, fluoroquinolones 2, aminoglycosides, carbapenems, piperacillin or piperacillin/tazobactam;
Multiresistant 3 : intermediate or resistant to an agent in three of the following six categories: cephalosporins 2, fluoroquinolones 2, aminoglycosides, carbapenems, piperacillin or piperacillin/tazobactam, ampicillin/sulbactam.
Figure 10 – Antibiotic Resistance in Gram-Positive Bacteria, Gram-Negative Bacteria and Pseudomonas sp., Québec, 2011–2015 to 2015–2016 (%)
Results Per Healthcare Facility
Table 8 presents 2015-2016 rates of CRBSI and of BSIs secondary to urinary tract and pulmonary infections, per healthcare facility.
Figure 11 – BSI Incidence Rate per Facility (2015–2016) and Percentile Ranking (2011–2012 to 2014–2015) for Teaching Healthcare Facilities, Québec, 2015–2016

Figure 12 – BSI Incidence Rate per Facility (2015–2016) and Percentile Ranking (2011–2012 to 2014–2015) for Non-Teaching Healthcare Facilities, Québec, 2015–2016
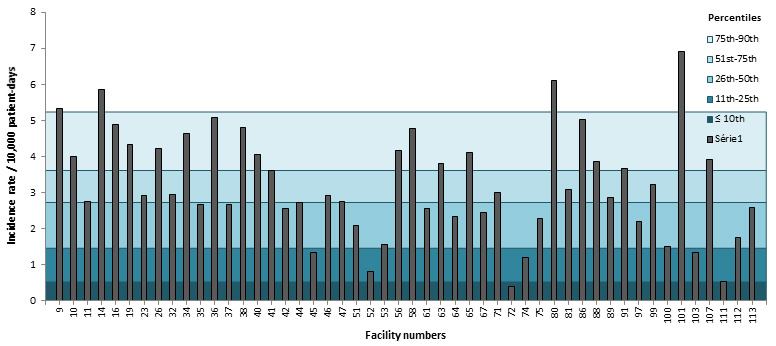
Note: facilities 49, 59, 70, 77, 82, 83, 84, 85, 95, 96 and 109 reported no admitted case of BSI in 2015-2016.
Table 8 – Incidence Rates of CRBSI and of BSIs Secondary to Urinary Tract and Pulmonary Infections per Facility, for Teaching Healthcare Facilities, Québec, 2015–2016 (Incidence Rate per 10,000 Patient-Days [95% CI])
|
Facility |
CRBSI |
Urinary Tract |
Pulmonary |
||||
|---|---|---|---|---|---|---|---|
|
Case (n) |
Incidence rates |
Case (n) |
Incidence rates |
Case (n) |
Incidence rates |
||
|
1 |
HÔPITAL CHARLES LEMOYNE |
9 |
0.70 [0.32 ; 1.23] |
4 |
0.31 [0.08 ; 0.69] |
3 |
0.23 [0.04 ; 0.57] |
|
2 |
HÔPITAL DE L'ENFANT-JÉSUS |
16 |
1.25 [0.71 ; 1.94] |
17 |
1.32 [0.77 ; 2.02] |
11 |
0.86 [0.43 ; 1.44] |
|
3 |
GLEN - ROYAL VICTORIA |
38 |
3.46 [2.45 ; 4.65] |
16 |
1.46 [0.83 ; 2.26] |
19 |
1.73 [1.04 ; 2.60] |
|
4 |
HÔPITAL NOTRE-DAME DU CHUM |
37 |
3.61 [2.54 ; 4.87] |
17 |
1.66 [0.97 ; 2.54] |
11 |
1.07 [0.53 ; 1.80] |
|
5 |
HÔPITAL GÉNÉRAL JUIF |
32 |
1.90 [1.30 ; 2.62] |
34 |
2.02 [1.40 ; 2.76] |
15 |
0.89 [0.50 ; 1.40] |
|
6 |
GLEN - ENFANTS |
63 |
14.95 [11.49 ; 18.87] |
1 |
0.24 [0 ; 0.94] |
0 |
0 |
|
7 |
PAVILLON L'HÔTEL-DIEU DE QUÉBEC |
8 |
0.93 [0.40 ; 1.69] |
21 |
2.45 [1.51 ; 3.61] |
7 |
0.82 [0.33 ; 1.54] |
|
8 |
PAVILLON MAISONNEUVE/PAVILLON MARCEL-LAMOUREUX |
33 |
1.76 [1.21 ; 2.41] |
32 |
1.71 [1.17 ; 2.35] |
10 |
0.53 [0.25 ; 0.91] |
|
9 |
HÔPITAL DU HAUT-RICHELIEU |
5 |
0.61 [0.19 ; 1.26] |
13 |
1.58 [0.84 ; 2.56] |
4 |
0.49 [0.13 ; 1.09] |
|
10 |
HÔPITAL PIERRE-BOUCHER |
5 |
0.46 [0.15 ; 0.95] |
11 |
1.00 [0.50 ; 1.68] |
7 |
0.64 [0.25 ; 1.20] |
|
11 |
HÔPITAL PIERRE-LE GARDEUR |
5 |
0.45 [0.14 ; 0.93] |
19 |
1.69 [1.01 ; 2.54] |
5 |
0.45 [0.14 ; 0.93] |
|
12 |
CENTRE HOSPITALIER UNIVERSITAIRE SAINTE-JUSTINE |
36 |
4.02 [2.81 ; 5.44] |
3 |
0.33 [0.06 ; 0.81] |
1 |
0.11 [0 ; 0.43] |
|
13 |
INSTITUT DE CARDIOLOGIE DE MONTRÉAL |
2 |
0.47 [0.04 ; 1.35] |
1 |
0.24 [0 ; 0.93] |
4 |
0.95 [0.25 ; 2.11] |
|
14 |
CENTRE HOSPITALIER RÉGIONAL DE LANAUDIÈRE |
7 |
0.72 [0.29 ; 1.35] |
13 |
1.34 [0.71 ; 2.17] |
8 |
0.82 [0.35 ; 1.49] |
|
15 |
HÔPITAL FLEURIMONT |
24 |
2.30 [1.47 ; 3.31] |
14 |
1.34 [0.73 ; 2.13] |
3 |
0.29 [0.06 ; 0.71] |
|
16 |
HÔPITAL RÉGIONAL DE RIMOUSKI |
2 |
0.36 [0.03 ; 1.03] |
7 |
1.27 [0.50 ; 2.38] |
4 |
0.73 [0.19 ; 1.62] |
|
18 |
HÔTEL-DIEU DE LÉVIS |
4 |
0.54 [0.14 ; 1.20] |
17 |
2.28 [1.33 ; 3.49] |
6 |
0.80 [0.29 ; 1.57] |
|
19 |
HÔPITAL CITÉ DE LA SANTÉ |
24 |
1.41 [0.90 ; 2.03] |
20 |
1.17 [0.71 ; 1.74] |
4 |
0.23 [0.06 ; 0.51] |
|
20 |
HÔPITAL DE CHICOUTIMI |
6 |
0.78 [0.28 ; 1.53] |
6 |
0.78 [0.28 ; 1.53] |
0 |
0 |
|
21 |
HÔPITAL SAINT-LUC DU CHUM |
17 |
1.68 [0.98 ; 2.57] |
12 |
1.19 [0.61 ; 1.96] |
4 |
0.40 [0.11 ; 0.88] |
|
22 |
HÔTEL-DIEU DU CHUM |
12 |
1.76 [0.91 ; 2.90] |
11 |
1.61 [0.80 ; 2.70] |
8 |
1.17 [0.50 ; 2.12] |
|
23 |
HÔTEL-DIEU D'ARTHABASKA |
0 |
0 |
0 |
0 |
6 |
1.16 [0.42 ; 2.28] |
|
24 |
HÔPITAL DU SAINT-SACREMENT |
4 |
0.74 [0.19 ; 1.64] |
4 |
0.74 [0.19 ; 1.64] |
2 |
0.37 [0.04 ; 1.06] |
|
25 |
HÔPITAL DU SACRÉ-COEUR DE MONTRÉAL |
47 |
3.26 [2.39 ; 4.26] |
28 |
1.94 [1.29 ; 2.73] |
9 |
0.63 [0.29 ; 1.11] |
|
26 |
HÔPITAL DE VERDUN |
10 |
1.28 [0.61 ; 2.20] |
8 |
1.03 [0.44 ; 1.87] |
6 |
0.77 [0.28 ; 1.51] |
|
27 |
PAVILLON CENTRE HOSPITALIER DE L'UNIVERSITÉ LAVAL |
14 |
1.18 [0.64 ; 1.88] |
2 |
0.17 [0.02 ; 0.49] |
3 |
0.25 [0.05 ; 0.62] |
|
28 |
PAVILLON SAINT-FRANCOIS D'ASSISE |
9 |
1.02 [0.46 ; 1.80] |
18 |
2.04 [1.21 ; 3.09] |
6 |
0.68 [0.24 ; 1.33] |
|
29 |
HÔPITAL GÉNÉRAL DE MONTRÉAL |
17 |
2.20 [1.28 ; 3.37] |
10 |
1.29 [0.61 ; 2.22] |
12 |
1.55 [0.80 ; 2.55] |
|
30 |
HOTEL-DIEU DE SHERBROOKE |
8 |
1.22 [0.52 ; 2.21] |
6 |
0.92 [0.33 ; 1.80] |
2 |
0.31 [0.03 ; 0.88] |
|
31 |
PAVILLON SAINTE-MARIE |
2 |
0.16 [0.02 ; 0.46] |
8 |
0.64 [0.27 ; 1.16] |
7 |
0.56 [0.22 ; 1.05] |
|
32 |
CENTRE HOSPITALIER RÉGIONAL DU GRAND-PORTAGE |
1 |
0.37 [0 ; 1.45] |
2 |
0.74 [0.07 ; 2.12] |
1 |
0.37 [0 ; 1.45] |
|
33 |
INSTITUT UNIVERSITAIRE DE CARDIOLOGIE ET DE PNEUMOLOGIE DE QUÉBEC |
15 |
1.57 [0.88 ; 2.47] |
4 |
0.42 [0.11 ; 0.93] |
0 |
0 |
|
34 |
HÔPITAL SANTA CABRINI |
1 |
0.09 [0 ; 0.36] |
20 |
1.90 [1.16 ; 2.82] |
7 |
0.66 [0.26 ; 1.24] |
|
35 |
HÔPITAL HONORÉ-MERCIER |
1 |
0.15 [0 ; 0.59] |
7 |
1.04 [0.41 ; 1.95] |
3 |
0.45 [0.09 ; 1.10] |
|
36 |
HÔPITAL GÉNÉRAL DU LAKESHORE |
2 |
0.28 [0.03 ; 0.80] |
14 |
1.93 [1.05 ; 3.07] |
8 |
1.10 [0.47 ; 2.00] |
|
37 |
HÔTEL-DIEU DE SOREL |
4 |
0.89 [0.23 ; 1.98] |
6 |
1.33 [0.48 ; 2.61] |
3 |
0.67 [0.13 ; 1.64] |
|
38 |
HÔPITAL JEAN-TALON |
3 |
0.60 [0.11 ; 1.47] |
10 |
2.00 [0.95 ; 3.43] |
9 |
1.80 [0.82 ; 3.17] |
|
39 |
HOPITAL DE GATINEAU |
- |
- |
- |
- |
- |
- |
|
40 |
HÔPITAL DE HULL |
4 |
0.60 [0.16 ; 1.33] |
14 |
2.11 [1.15 ; 3.36] |
6 |
0.90 [0.32 ; 1.77] |
|
41 |
HÔPITAL DU CENTRE-DE-LA-MAURICIE |
2 |
0.43 [0.04 ; 1.23] |
9 |
1.92 [0.87 ; 3.38] |
0 |
0 |
|
42 |
CENTRE HOSPITALIER ANNA-LABERGE |
1 |
0.14 [0 ; 0.54] |
10 |
1.35 [0.64 ; 2.32] |
5 |
0.68 [0.22 ; 1.4] |
|
44 |
HÔPITAL SAINTE-CROIX |
1 |
0.18 [0 ; 0.71] |
8 |
1.45 [0.62 ; 2.63] |
1 |
0.18 [0 ; 0.71] |
|
45 |
HÔPITAL DE SAINT-EUSTACHE |
6 |
0.67 [0.24 ; 1.31] |
4 |
0.45 [0.12 ; 1.00] |
0 |
0 |
|
46 |
HÔPITAL DE GRANBY |
3 |
0.63 [0.12 ; 1.54] |
10 |
2.09 [1.00 ; 3.59] |
1 |
0.21 [0 ; 0.82] |
|
47 |
HÔPITAL DE ROUYN-NORANDA |
1 |
0.40 [0 ; 1.56] |
4 |
1.58 [0.41 ; 3.51] |
0 |
0 |
|
48 |
CENTRE HOSPITALIER DE ST. MARY |
7 |
0.88 [0.35 ; 1.65] |
11 |
1.39 [0.69 ; 2.33] |
1 |
0.13 [0 ; 0.50] |
|
49 |
CENTRE DE SANTÉ ET DE SERVICES SOCIAUX MEMPHRÉMAGOG |
0 |
0 |
0 |
0 |
0 |
0 |
|
51 |
HÔPITAL DE MANIWAKI |
0 |
0 |
2 |
1.40 [0.13 ; 4.01] |
0 |
0 |
|
52 |
HÔPITAL D'AMOS |
0 |
0 |
1 |
0.41 [0 ; 1.61] |
0 |
0 |
|
53 |
HÔPITAL DE CHANDLER |
0 |
0 |
0 |
0 |
1 |
0.79 [0 ; 3.09] |
|
56 |
CENTRE DE SANTÉ ET DE SERVICES SOCIAUX D'ARGENTEUIL |
3 |
2.09 [0.39 ; 5.12] |
1 |
0.70 [0 ; 2.74] |
1 |
0.70 [0 ; 2.74] |
|
58 |
HÔPITAL DU SUROÎT |
6 |
0.99 [0.36 ; 1.94] |
9 |
1.49 [0.68 ; 2.62] |
2 |
0.33 [0.03 ; 0.95] |
|
59 |
HÔPITAL DE BAIE-SAINT-PAUL |
0 |
0 |
0 |
0 |
0 |
0 |
|
61 |
HÔPITAL NOTRE-DAME-DE-FATIMA |
0 |
0 |
0 |
0 |
0 |
0 |
|
63 |
HÔPITAL DE SAINT-GEORGES |
0 |
0 |
2 |
0.51 [0.05 ; 1.46] |
0 |
0 |
|
64 |
HÔPITAL LE ROYER |
0 |
0 |
3 |
1.17 [0.22 ; 2.86] |
2 |
0.78 [0.07 ; 2.23] |
|
65 |
HÔPITAL ET CLSC DE VAL-D'OR |
3 |
1.23 [0.23 ; 3.02] |
3 |
1.23 [0.23 ; 3.02] |
3 |
1.23 [0.23 ; 3.02] |
|
67 |
HÔPITAL ET CENTRE DE RÉADAPTATION DE JONQUIÈRE |
0 |
0 |
5 |
1.36 [0.43 ; 2.82] |
2 |
0.55 [0.05 ; 1.57] |
|
70 |
CENTRE DE SOINS DE COURTE DURÉE LA SARRE |
0 |
0 |
0 |
0 |
0 |
0 |
|
71 |
HÔPITAL DE MATANE |
0 |
0 |
2 |
1.50 [0.14 ; 4.30] |
0 |
0 |
|
72 |
HÔPITAL ET CENTRE D'HÉBERGEMENT DE SEPT-ÎLES |
0 |
0 |
0 |
0 |
0 |
0 |
|
74 |
HÔPITAL DE DOLBEAU-MISTASSINI |
1 |
0.60 [0 ; 2.34] |
1 |
0.60 [0 ; 2.34] |
0 |
0 |
|
75 |
CENTRE DE SANTÉ ET DE SERVICES SOCIAUX DU GRANIT |
0 |
0 |
1 |
1.14 [0 ; 4.47] |
0 |
0 |
|
76 |
HÔPITAL DE LACHINE |
1 |
0.59 [0 ; 2.32] |
2 |
1.19 [0.11 ; 3.41] |
2 |
1.19 [0.11 ; 3.41] |
|
77 |
HÔPITAL D'AMQUI |
0 |
0 |
0 |
0 |
0 |
0 |
|
80 |
HÔPITAL FLEURY |
8 |
1.81 [0.77 ; 3.28] |
10 |
2.27 [1.08 ; 3.89] |
5 |
1.13 [0.36 ; 2.34] |
|
81 |
HÔPITAL DE MONT-LAURIER |
1 |
0.62 [0 ; 2.43] |
1 |
0.62 [0 ; 2.43] |
0 |
0 |
|
82 |
PAVILLON SAINTE-FAMILLE |
0 |
0 |
0 |
0 |
0 |
0 |
|
83 |
HÔPITAL DE LASALLE |
0 |
0 |
0 |
0 |
0 |
0 |
|
84 |
HÔPITAL DE NOTRE-DAME-DU-LAC |
1 |
1.32 [0 ; 5.17] |
0 |
0 |
0 |
0 |
|
85 |
CENTRE DE SANTÉ ET DE SERVICES SOCIAUX DU HAUT-SAINT-MAURICE |
0 |
0 |
0 |
0 |
0 |
0 |
|
86 |
HÔPITAL DE LA MALBAIE |
0 |
0 |
4 |
4.03 [1.05 ; 8.95] |
1 |
1.01 [0 ; 3.96] |
|
88 |
HÔPITAL. CLSC ET CENTRE D'HÉBERGEMENT DE ROBERVAL |
0 |
0 |
7 |
2.46 [0.98 ; 4.62] |
0 |
0 |
|
89 |
HÔPITAL DE MONTMAGNY |
2 |
1.15 [0.11 ; 3.30] |
2 |
1.15 [0.11 ; 3.3] |
0 |
0 |
|
91 |
HÔPITAL HÔTEL-DIEU DE GASPÉ |
0 |
0 |
1 |
0.92 [0 ; 3.60] |
0 |
0 |
|
95 |
HÔPITAL DU PONTIAC |
0 |
0 |
0 |
0 |
0 |
0 |
|
96 |
CENTRE DE SANTÉ DE CHIBOUGAMAU |
0 |
0 |
0 |
0 |
0 |
0 |
|
97 |
HÔPITAL DE MARIA |
1 |
0.55 [0 ; 2.16] |
2 |
1.10 [0.10 ; 3.15] |
1 |
0.55 [0 ; 2.16] |
|
99 |
HÔPITAL BROME-MISSISQUOI-PERKINS |
2 |
0.72 [0.07 ; 2.06] |
2 |
0.72 [0.07 ; 2.06] |
1 |
0.36 [0 ; 1.41] |
|
100 |
HÔPITAL DE LA BAIE |
0 |
0 |
1 |
0.76 [0 ; 2.97] |
0 |
0 |
|
101 |
HÔPITAL RÉGIONAL DE SAINT-JÉRÔME |
17 |
1.55 [0.90 ; 2.37] |
15 |
1.36 [0.76 ; 2.14] |
10 |
0.91 [0.43 ; 1.56] |
|
103 |
HÔPITAL LAURENTIEN |
3 |
1.00 [0.19 ; 2.45] |
1 |
0.33 [0 ; 1.30] |
0 |
0 |
|
107 |
HÔPITAL DE L'ARCHIPEL |
1 |
1.31 [0 ; 5.13] |
1 |
1.31 [0 ; 5.13] |
0 |
0 |
|
109 |
HÔPITAL DE SAINTE-ANNE-DES-MONTS |
1 |
1.62 [0 ; 6.35] |
0 |
0 |
0 |
0 |
|
111 |
HÔPITAL DE PAPINEAU |
0 |
0 |
1 |
0.54 [0 ; 2.11] |
0 |
0 |
|
112 |
HÔPITAL D'ALMA |
1 |
0.35 [0 ; 1.38] |
2 |
0.71 [0.07 ; 2.03] |
1 |
0.35 [0 ; 1.38] |
|
113 |
HÔPITAL DE THETFORD MINES |
0 |
0 |
1 |
0.43 [0 ; 1.69] |
0 |
0 |
|
118 |
HÔPITAL NEUROLOGIQUE DE MONTRÉAL |
3 |
1.35 [0.25 ; 3.31] |
8 |
3.61 [1.54 ; 6.55] |
5 |
2.26 [0.71 ; 4.67] |
|
130 |
HOPITAL BARRIE MEMORIAL |
- |
- |
- |
- |
- |
- |
Abbreviations
95% CI: 95% confidence interval
BSI: bloodstream infection
CoNS: coagulase-negative Staphylococcus
CRBSI: catheter-related bloodstream infection
HD: hemodialysis
ICU: intensive care unit
MBI: mucosal barrier injury
Non-CRBSI: non-catheter-related primary bloodstream infection
SSI: surgical site infection
Author
Comité de surveillance provinciale des infections nosocomiales (SPIN) – bactériémies panhospitalières
Editorial Committee
Alex Carignan, Centre hospitalier universitaire de Sherbrooke
Christophe Garenc, Direction des risques biologiques et de la santé au travail, Institut national de santé publique du Québec
Élise Fortin, Direction des risques biologiques et de la santé au travail, Institut national de santé publique du Québec
Danielle Moisan, Centre hospitalier régional du Grand-Portage
Muleka Ngenda-Muadi, Direction des risques biologiques et de la santé au travail, Institut national de santé publique du Québec
Isabelle Rocher, Direction des risques biologiques et de la santé au travail, Institut national de santé publique du Québec
Mélissa Trudeau, Direction des risques biologiques et de la santé au travail, Institut national de santé publique du Québec
Jasmin Villeneuve, Direction des risques biologiques et de la santé au travail, Institut national de santé publique du Québec